
Digital Unified Global Geologic Map of the Moon
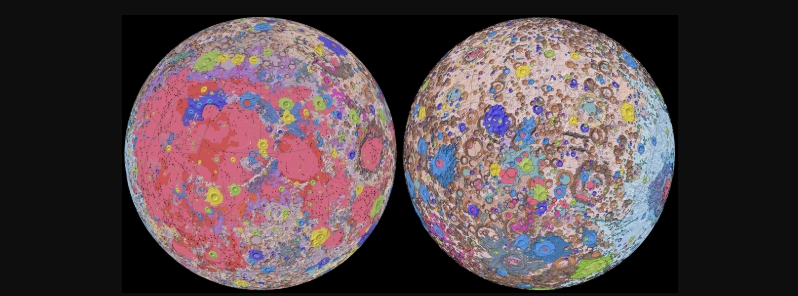
Image credit: NASA/GSFC/USGS
The United States Geological Survey (USGS), in collaboration with NASA and the Lunar Planetary Institute, has released the Unified Geologic Map of the Moon– the first time the entire lunar surface has been completely mapped.
"People have always been fascinated by the moon and when we might return," said USGS Director Jim Reilly, a former NASA astronaut. "So, it’s wonderful to see USGS create a resource that can help NASA with their planning for future missions."
Scientists used data from six regional maps from the Apollo era to create a new digital map, as well as updated information from current satellite missions to the Moon.
The existing historical maps were redrawn to align them with the modern ones. Merging old and new data allows past observations and interpretations to be preserved.
The researchers also developed a consolidated description of the stratigraphy or the Moon's rock layers, resolving issues from previous maps such as inconsistent rock names, descriptions, and ages.

Image credit: NASA/GSFC/USGS

Image credit: NASA/GSFC/USGS
"This map is a culmination of a decades-long project," said study lead author and USGS geologist, Corey Fortezzo. "It provides vital information for new scientific studies by connecting the exploration of specific sites on the moon with the rest of the lunar surface."
Elevation data for the Moon's equatorial region came from stereo observations gathered by the terrain Camera on the Selenological and Engineering Explorer (SELENE) mission led by the Japanese Aerospace Exploration Agency (JAXA).
Meanwhile, the topography for the north and south poles was provided by NASA's Lunar Orbiter Laser Altimeter data.
The lunar map will serve as the authoritative blueprint of the Moon's surface geology, which will be used for future human missions. The map will also be invaluable for the international scientific community and the public in general. The map shows the moon's geology in incredible detail, at a 1:5 000 000 scale.

Reference
Fortezzo, C. M. et al. – Release of the Digital Unified Global Geologic Map of the Moon At 1:5,000,000- Scale – 51st Lunar and Planetary Science Conference, Lunar and Planetary Institute – https://www.hou.usra.edu/meetings/lpsc2020/pdf/2760.pdf
Abstract
This new work represents a seamless, globally consistent, 1:5,000,000-scale geologic map derived from the six digitally renovated geologic maps (see Source Online Linkage below). The goal of this project was to create a digital resource for science research and analysis, future geologic mapping efforts, be it local-, regional-, or global-scale products, and as a resource for the educators and the public interested in lunar geology. Here we present the completed mapping project as unit contacts, geologic unit polygons, linear features, and unit and feature nomenclature annotation. The product is overlies shaded-relief derived from SELENE Kaguya terrain camera stereo (equatorial, ~60 m/pix) and LOLA altimetry (north and south polar, 100 m/pix). These data are not included with this download due to size considerations, but a readme in the "Lunar_Raster" folder provides the download links. This download page includes a PDF of the geologic map (right-side) with a brief Description of Map Units and Explanation of Map Symbols, as well as a JPG of the map for quick access viewing. This release is subject to update based on community feedback and peer-review.

Published in the last 24 hours
- Lava fountains reached 1,900 feet (580 m) at Kīlauea Iki in 1959, the highest ever recorded at Kīlauea, as USGS forecasts episode 57 fountaining at Halemaʻumaʻu for November 22-26. Epicenter
- Novarupta in Alaska erupted about 3 cubic miles of magma in roughly 60 hours from 6 June 1912, 30 times Mount St. Helens in 1980, and strong northwesterly winds lifted that same loose ash on 16 November 2026, prompting an NWS SIGMET. Epicenter
- A fog linked to about 12 000 excess deaths in London in 1952 puzzled scientists for decades, until researchers reconstructed how coal smoke formed acidic haze Epicenter
- In 2012, cameras filming a thunderstorm in western China caught ball lightning by accident, and its 1.64-second glow carried iron, silicon, and calcium from the soil it rose out of Epicenter
