
NOAA forecasts larger than average ‘dead ‘zone’ for Gulf of Mexico
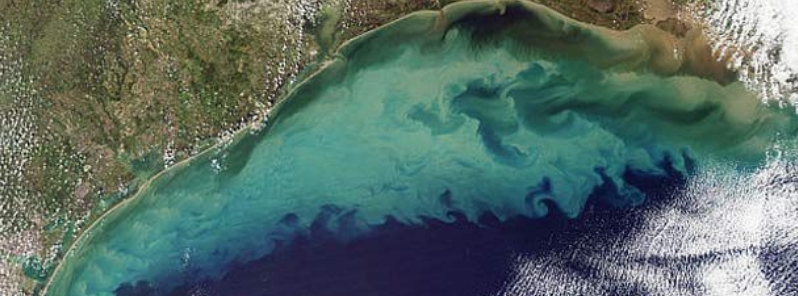
Image credit: Jeff Schmaltz/NASA Earth Observatory/Wikimedia
The hypoxic area or "dead zone"– an area of reduced oxygen level which kills marine life– in the Gulf of Mexico is forecast to be approximately 10 800 square km (6 700 square miles) larger than the long-term average of about 8 700 square km (5 400 square miles), according to scientists from the National Oceanic and Atmospheric Administration (NOAA). The yearly prediction is based on USGS river-flow and nutrient data.
The Gulf's dead zone, which occurs every summer, is primarily caused by excess nutrient pollution from human activities in the agricultural and urban areas throughout the Mississippi watershed.
"Information on where sources contribute nutrients across the watershed can help guide management approaches in the Gulf," said Don Cline, associate director for the USGS Water Resources Mission Area.
When the extra nutrients reach the waters, they trigger an overgrowth of algae, which eventually perish and decompose, reducing oxygen as they sink to the bottom.
As a result, low oxygen levels near the Gulf's bottom would not be able to support marine life– fish, shrimp, and crabs usually swim out of the area, but some animals that are unable to swim would be killed by lack of oxygen.
"Not only does the dead zone hurt marine life, but it also harms commercial and recreational fisheries and the communities they support," said Nicole Leboeuf, acting director of NOAA's National Ocean Service.
"The annual dead zone makes large areas unavailable for species that depend on them for their survival and places continued strain on the region’s living resources and coastal economies."
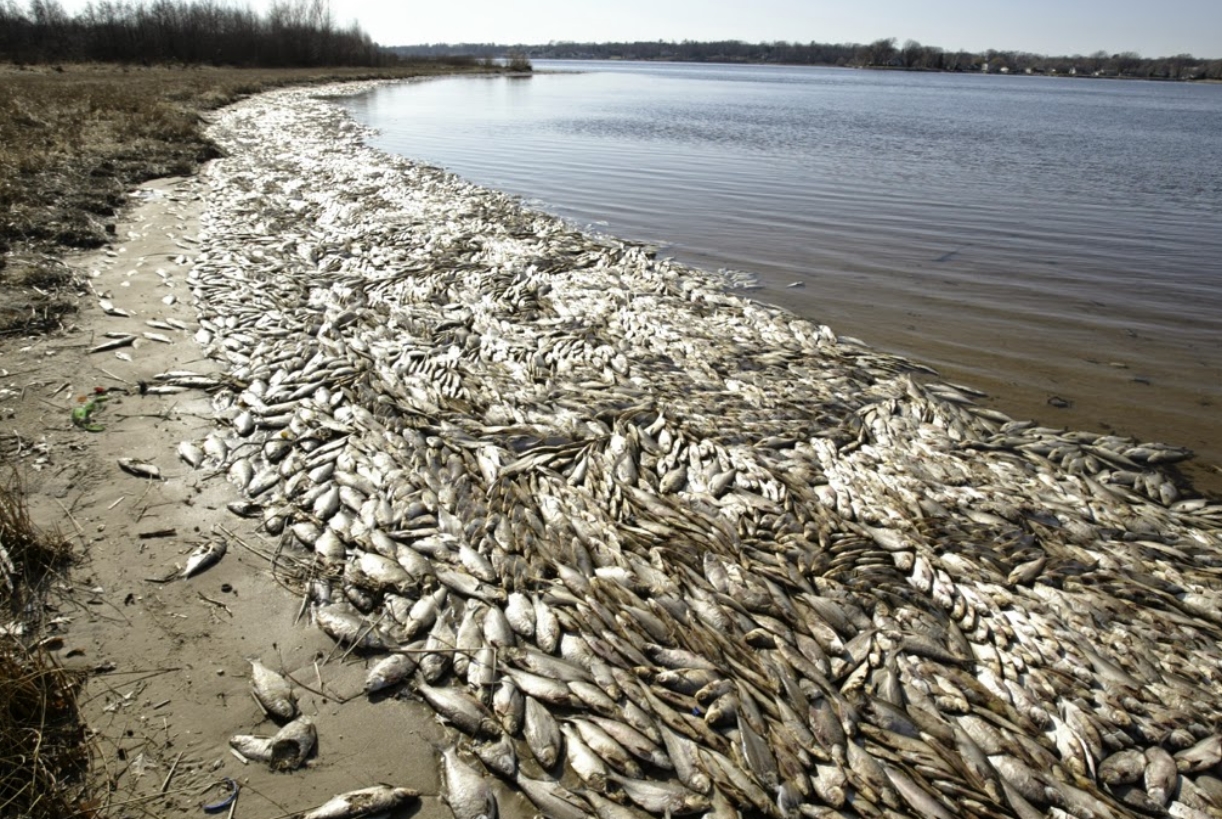
Fish death due to low oxygen content in water. Image credit: ARCGIS
A significant factor contributing to this year's above-average dead zone is the high river flows and nutrient loads sent to the Gulf this spring, primarily from the Mississippi and Atchafalaya rivers.
In May 2020, discharge in both rivers was around 30 percent above the long-term average between 1980 and 2019.
"The USGS estimates that this larger-than-average river discharge carried 136 000 metric tons of nitrate and 21 400 metric tons of phosphorus into the Gulf of Mexico in May alone," USGS noted.
"These nitrate loads were about 2 percent above the long-term average, and phosphorus loads were about 25 percent above the long-term average."
To measure nutrients in rivers throughout the Mississippi Atchafalaya watershed, the agency operates more than 3 000 real-time stream gauges, 50 real-time nitrate sensors, and 35 long-term monitoring sites.
While the hypoxic area prediction assumes typical coastal weather conditions, the measured dead zone size could be interrupted. Its size could also be changed by major weather events like hurricanes and tropical storms, which combine ocean waters, as what happened in 2018 and 2019.
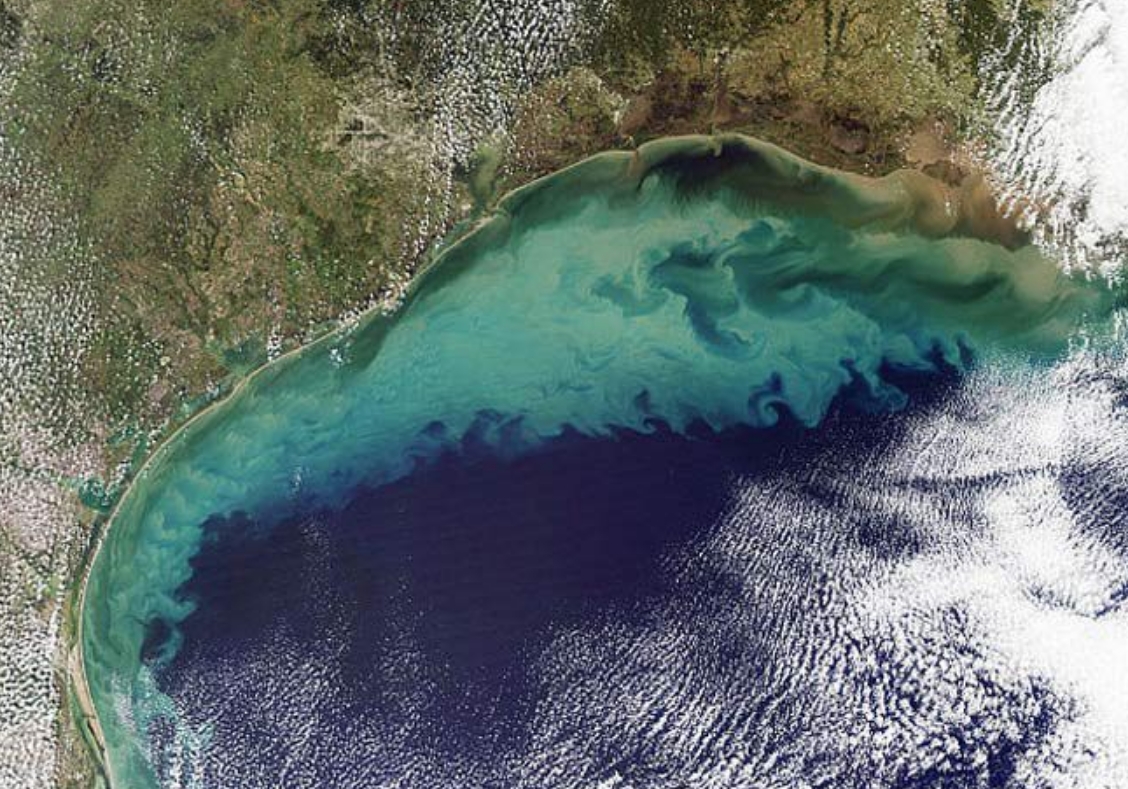
Image credit: Jeff Schmaltz/NASA Earth Observatory/Wikimedia
A monitoring survey supported by NOAA will confirm the size of the 2020 dead zone and is a key test of the precision of NOAA's models.
The Mississippi River/Gulf of Mexico Hypoxia Task Force, a team working to lessen the dead zone in the gulf, has set a five-year average measured size target of 4 900 square km (1 900 square miles).
The NOAA models help forecast how the Gulf hypoxia is associated with nutrients coming from throughout the Mississippi River Basin. The team uses them to help inform total nutrient reduction targets across the watershed.
This is the third year NOAA is creating its own forecast, using a suite of NOAA-supported hypoxia models developed by the agency and its partners.
These include teams of researchers at the University of Michigan, Louisiana State University, William & Mary’s Virginia Institute of Marine Science, North Carolina State University, and Dalhousie University, and the USGS.
NOAA and its partners continue to produce additional hypoxia forecast capabilities to learn more about its impacts on living marine resources, the relationship between hypoxia volume and area, and how the dead zone changes over time across the Gulf.
Commenting rules and guidelines
We value the thoughts and opinions of our readers and welcome healthy discussions on our website. In order to maintain a respectful and positive community, we ask that all commenters follow these rules.