
2019 IOD event developing into one of the strongest on record, Extreme rainfall expected in Eastern Africa
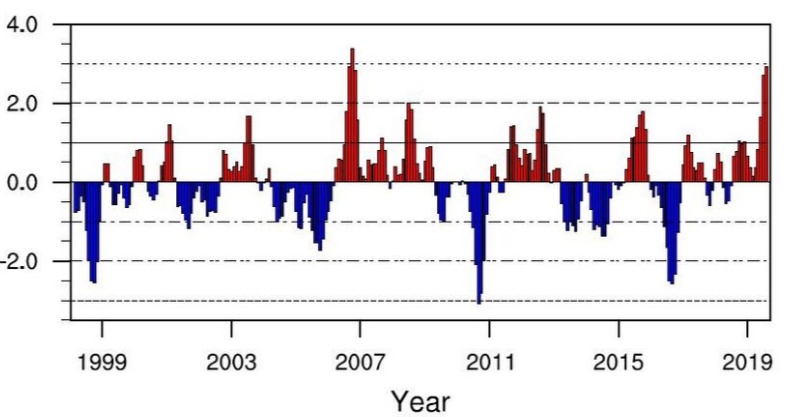
Image credit: Dr. Saji N Hameed
Dr. Saji N Hameed, one of the scientists who discovered Indian Ocean Dipole (IOD) said recently 2019 is shaping up to be one of the strongest IOD years ever recorded.
A strong IOD year indicates extreme rainfall in Eastern Africa from October to December, possibly leading to millions of displaced people, the emergence of Rift Valley fever and other flood-related issues. Dry spells over Indonesia, Australia and Singapore are strongly tied to the ongoing IOD.
2019 IOD is already similar to one of strongest IOD events in history – that of 2006 – when Eastern Africa experienced its worst floods in history, together with Central and West Africa.
The Indian Ocean Dipole, also known as the Indian Niño, is an irregular oscillation of sea surface temperatures (SST) in which the western Indian Ocean becomes alternately warmer and then colder than the eastern part of the ocean.
The IOD involves an aperiodic oscillation of SST, between "positive", "neutral" and "negative" phases. A positive phase sees greater-than-average SST and greater precipitation in the western Indian Ocean region, with a corresponding cooling of waters in the eastern Indian Ocean – which tends to cause droughts in adjacent land areas of Indonesia and Australia. The negative phase of the IOD brings about the opposite conditions, with warmer water and greater precipitation in the eastern Indian Ocean, and cooler and drier conditions in the west.
"Strong IOD events tend to occur roughly every 10 years. The reasons for this are only being investigated," Hameed told TWC.
"The countries that are strongly affected by IOD are those in the eastern Indian Ocean (Indonesia to Australia) and equatorial Eastern Africa, where IOD leads to severe lack of rainfall. Moderate impacts are found over portions of India up to southern Iran. We have also found that IOD can lead to excessively warm (southern hemisphere) spring seasons over central portions of South America (e.g. Bolivia). We don't expect these impacts to vary by decade.
"IOD usually manifests first around early summer and strengthens to a peak in late fall. The current IOD is also following this pattern and has significantly strengthened during August. In fact, it is now very similar in its strength to one of the strongest IOD events in recent decades, that of 2006."
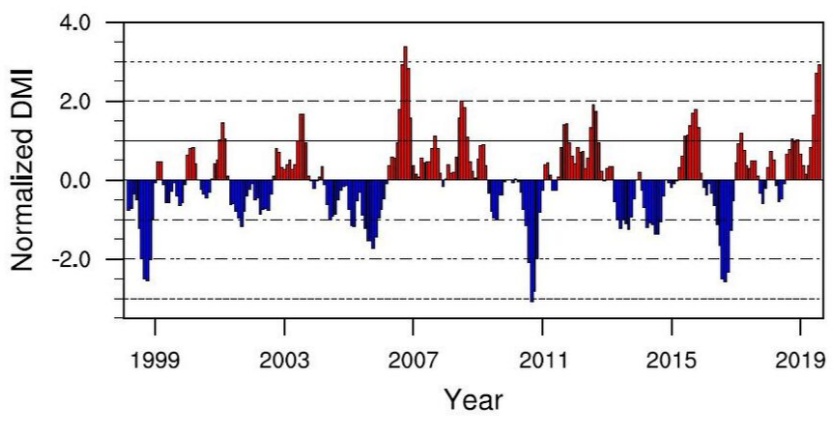
Yearly changes in the Dipole Mode Index (DMI) – DMI is defined as the sea surface temperature anomaly difference between tropical western Indian Ocean and the southeastern Indian Ocean. Positive DMI values (red) point to a positive IOD year, and negative values (blue) to negative IOD years. Image credit: Dr. Saji N Hameed (http://enformtk.u-aizu.ac.jp)
"I mostly fear about the situation in East Africa, which is vulnerable even without an adverse climate event. We are talking about millions of people being displaced, emergence of Rift Valley fever and other flood-related issues as experienced during the strong IOD of 2006," Hameed said.
"The dry spells over Indonesia, Australia and Singapore are strongly tied to the ongoing IOD. In fact, the Australian weather agency has been alerting Australians to adverse climate associated with IOD since early spring of this year. The weather agency of Singapore has, similarly, associated the dry spells over Singapore with IOD."
I'm a dedicated researcher, journalist, and editor at The Watchers. With over 20 years of experience in the media industry, I specialize in hard science news, focusing on extreme weather, seismic and volcanic activity, space weather, and astronomy, including near-Earth objects and planetary defense strategies. You can reach me at teo /at/ watchers.news.
What precedent? Even in this short series, 2006 saw a comparable DMI. In the longer series, two were comparable in the 1990s…Meanwhile, the record negative dipole occurred in a 7-year back-to-back negative dipoles in the 1960s (not in the early part of that century, as one might think if ‘warming’ were the cause of positive dipoles, or closer to now, if ‘warming’ were to cause their extremes).
Current DMI has hit 1.94………scary precedent.
Please advise what the record negative value is, and what years extreme negative values were recorded. For reference, I’m in eastern australia.
Cheers Peter Brookhouse