WMO Statement on the Status of the Global Climate – 10 warmest year on record, lowest sea ice volume

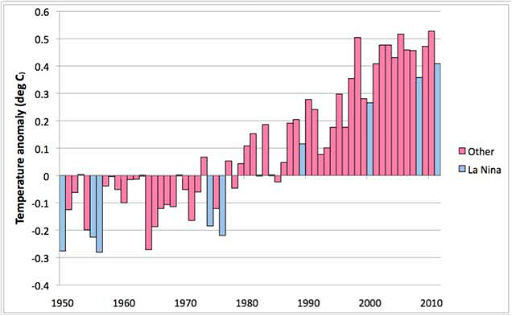
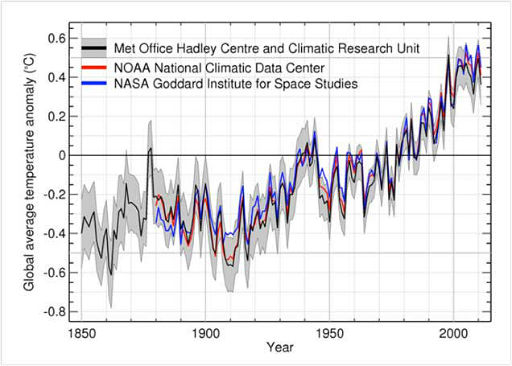
WMO issued preliminary Status of the Global Climate report. Global temperatures in 2011 are currently the tenth highest on record and are higher than any previous year with La Niña event, which has a relative cooling influence. The 13 warmest years have all occurred in the 15 years since 1997. The extent of Arctic sea ice in 2011 was the second lowest on record, and its volume was the lowest.
These are some of the highlights of the provisional annual World Meteorological Organization Statement on the Status of the Global Climate, which gives a global temperature assessment and a snapshot of weather and climate events around the world in 2011. It was released on November 29, 2011 at the international climate conference in Durban, South Africa. Delegates from almost 200 nations have gathered in Durban for the UN Climate Change Conference.
Countries are expected to make a last effort to save the dying Kyoto Protocol, which was adopted in 1997 and entered into force in 2005. The talks are the last chance to set another round of targets before the first commitment period ends in 2012. The European Union is willing to sign up for a second commitment period of the Kyoto Protocol but other signatories, including Russia, Japan and Canada, are not. The United States – the world’s second biggest emitter after China – never ratified the protocol. Major developing nations with surging economies, such as China and India, were not covered in the first commitment period as they were classified as emerging economies.
Highlights of report
This preliminary information for 2011 is based on climate data from networks of land-based weather and climate stations, ships and buoys, as well as satellites. The data are continuously collected and disseminated by the National Meteorological and Hydrological Services (NMHSs) of the 189 Members of WMO and several collaborating research institutions. The data continuously feed three main depository global climate data and analysis centres, which develop and maintain homogeneous global climate datasets based on peer-reviewed methodologies.
Final updates and figures for 2011 will be published in March 2012 in the annual WMO Statement on the Status of the Global Climate. This provisional statement is For use of the information media, it is Not an official record for now.
Global temperatures
Global temperatures in 2011 have not been as warm as the record-setting values seen in 2010 but have likely been warmer than any previous strong La Niña year, based on preliminary data from data sources compiled by the World Meteorological Organisation (WMO). The global combined sea surface and land surface air temperature for 2011 (January–October) is currently estimated at 0.41°C ± 0.111°C (0.74°F ± 0.20°F) above the 1961–1990 annual average of 14.00°C/57.2°F. At present, 2011’s nominal value ranks as the equal 10th highest on record, and the 13 warmest years have all occurred in the 15 years between 1997 and 2011. Model reanalysis data from the European Centre for Medium-Range Weather Forecasts (ECMWF) are also consistent with this ranking. The 10-year average for the period 2002-11, at 0.46°C above the long-term average, equals 2001-10 as the warmest 10-year period on record. Final annual figures for 2011 will be available once November and December data are available in early 2012.
 Surface air temperatures were above the long-term average in 2011 over most land areas of the world. The largest departures from average were over Russia, especially in northern Russia where January-October temperatures were about 4°C above average in places. The spring was especially warm in this region with some stations more than 9°C above average for the season, whilst European Russia had another hot summer (the third-hottest on record in Moscow), although not as extreme as that of 2010. The hot summer conditions extended into nearby countries, with Helsinki (Finland) having its hottest summer in nearly 200 years of data, and Armenia setting an all-time national record (43.7°C).
January-October 2011 was also 1°C or more above average over large parts of Europe, southwest Asia and northern and central Africa, as well as the southern United States and northern Mexico, most of eastern Canada (especially the northeast), and Greenland. The Central American region is on course to have its hottest year in at least 140 years, while Spain has also had its hottest January-October period on record and several other western European countries approached records. The above-average temperatures in most northern polar regions were associated with the second-lowest Arctic sea ice minimum on record.
The most significant area of below-normal temperatures in 2011 was in northern and central Australia where temperatures were up to 1°C below average in places, largely the result of above-average cloudiness and heavy rain early in the year. Other regions to experience below-normal temperatures in 2011 included the western United States and south-western Canada, and parts of east Asia including the Indochina Peninsula, eastern China and the Korean Peninsula.
La Niña influence
Global climate in 2011 was heavily influenced by the strong La Niña event which developed in the tropical Pacific in the second half of 2010 and continued until May 2011. This event, which on most measures was one of the strongest of at least the last 60 years, was closely associated with many of the year’s notable regional climate events, including drought in east Africa, the central equatorial Pacific and the southern United States, and flooding in southern Africa, eastern Australia and southern Asia. Strong La Niña years are typically 0.10 to 0.15°C cooler than the years preceding and following them. 2011’s global temperatures followed this pattern, being lower than those of 2010, but were still warmer than the most recent moderate to strong La Niña years, 2008 (+0.36°C), 2000 (+0.27°C) and 1989 (+0.12°C). La Niña conditions have redeveloped in recent weeks but are not expected to approach the intensity seen in late 2010 and early 2011.
Sea ice
Arctic sea ice extent was again well below normal in 2011. After tracking at record or near-record low levels for the time of year through the first half of 2011, the seasonal minimum, reached on 9 September, was 4.33 million square kilometres (35% below the 1979-2000 average). This was the second-lowest seasonal minimum on record, 0.16 million square kilometres above the record low set in 2007. Unlike the 2007 season, both the Northwest and Northeast Passages were ice-free for periods during the 2011 summer. Sea ice volume was even further below average and was estimated at a new record low of 4200 cubic kilometres, surpassing the record of 4580 cubic kilometres set in 2010.

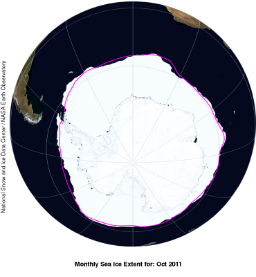 These images, derived from passive microwave satellite data, depict average sea ice conditions for last month. Extent images show the total area of ocean covered with at least 15 percent ice. (Source: National Snow and Ice Data Center)
East Africa severe drought and floods
Severe drought developed in parts of east Africa in late 2010 and continued through most of 2011. The most severely affected area encompassed the semi-arid regions of eastern and northern Kenya, western Somalia and some southern border areas of Ethiopia. In this region, rainfall was well below normal for two successive rainy seasons, the “short rains” of October-December 2010 and the “long rains” of March-May 2011. Drought in 2010-11 was rated alongside 1983-84 and 1999-2000 as the three most significant of the last 60 years over eastern and northern Kenya; it was the driest 12-month period on record at some locations within the region. (The 2004-05 drought also had a large impact over the wider region but was less intense in Kenya). Rainfall for the 12 months from October 2010 to September 2011 was 50% to 80% below normal over most of the area. The humanitarian impacts of the drought were severe, especially in Somalia and Kenya, with significant famine and large-scale displacement of population. The UN Office for Coordination of Humanitarian Affairs (OCHA) estimated that 13 million people required humanitarian aid.
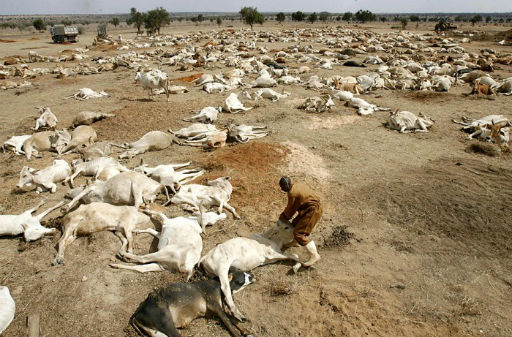
There was a dramatic change to the pattern in early October, with heavy rains beginning in the second week of the month and continuing into early November. Many parts of north-eastern and coastal Kenya have already received well in excess of their average rainfall for the full October-December season. Wajir, in north-eastern Kenya, only received 73 millimetres of rain in the 12 months from October 2010 to September 2011 (76% below the long-term average of 310 millimetres), its driest 12-month period in the post-1950 period, but has received 402 millimetres between 1 October and 12 November, already more than its annual average. Whilst the recent rains have provided relief in the worst-affected areas, the resultant floods have caused some crop damage and other disruption.
Major floods in south-east Asia
Rainfall was well above average during the 2011 monsoon season (June-September) through large parts of south-east Asia. Over most of Laos and in northern and central Thailand, rainfall for the June-September period was 20-80% above average, and averaged over northern Thailand as a whole, June-September rainfall was 38% above average, with all four months being significantly wetter than average, a highly unusual event.
The largest rainfall anomalies were over the Mekong River basin and the upper part of the Chao Phraya river basin. After earlier lesser flood episodes, the wet season culminated with severe flooding which moved downstream in both rivers from late September onwards. The floods caused major loss of life in Thailand, Cambodia and Myanmar, with at least 930 deaths across the three countries, and produced widespread inundation across all three countries as they moved downstream.
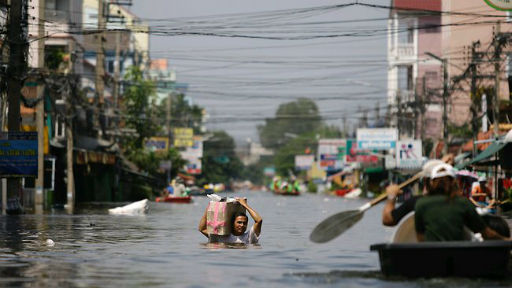
Severe and long-lived flooding, exacerbated by high tides, affected many parts of the major city of Bangkok from mid-October onwards and persisted for several weeks. In addition to human casualties, there were major losses in throughout the region in agriculture and industrial production, amounting to at least several billion US dollars.
Extremes in the United States and southern Canada
Extreme drought affected parts of the southern United States and adjacent parts of northern Mexico. The core of the drought was in Texas, where state-wide averaged rainfall for January-October 2011 was 273 millimetres (56% below normal), well below the previous record of 327 millimetres set in 1956. The drought region also had an exceptionally hot summer, with Texas’s summer (June-August) mean temperatures (30.4°C (86.7°F), being 3.0°C (5.4°F) above the long-term average) and the highest ever recorded for any American state. In addition to agricultural losses and water shortages, impacts of the drought included severe wildfires and dust storms.

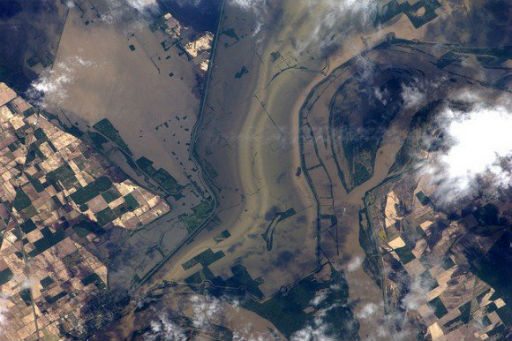
In marked contrast, many northern and central parts of the United States experienced heavy rain and flooding in 2011. The January-October period was the wettest on record for several north-eastern states and for the north-east region as a whole, with precipitation totals widely 30-50% above normal. The most severe floods in this region, reaching record levels in places, were associated with Hurricane Irene in August and Tropical Storm Lee in September. Spring and early summer were extremely wet in many central areas, particularly the Ohio Valley and the upper Midwest of the United States and the Prairie provinces of Canada, which experienced some of the worst flooding on record. There was also substantial spring flooding in the north-eastern United States and the Canadian province of Quebec. The heavy spring rains, combined with the melting of a heavy winter snowpack in northern areas, caused major downstream flooding during May and June. Parts of the Mississippi River experienced the worst floods since 1933, and there was also major flooding in the Missouri River and several Canadian rivers.
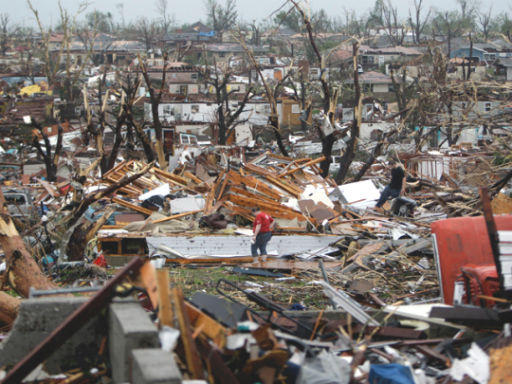
It was also one of the most active tornado seasons on record, with numerous major outbreaks, particularly in April and May. A tornado caused 157 deaths in Joplin, Missouri in May, the deadliest single tornado in the United States since 1947. 2011 (to date) has had the third-greatest number of tornadoes since 1950, after 2004 and 2008, and the fourth-greatest number of deaths (537) on record. There were also a number of major snowstorms, including the most significant October snowstorm on record in the north-eastern states.
Worldwide floodings and landslides
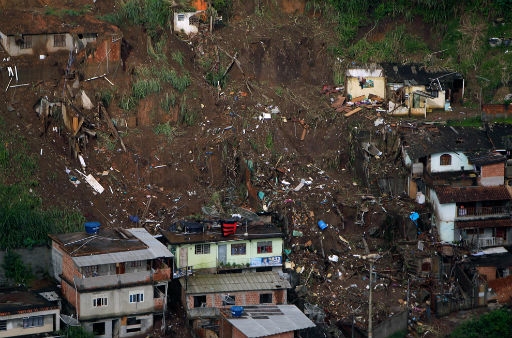
Flooding affected many parts of the world in 2011, both flash floods and more long-lived events. In terms of loss of life, the most extreme single event occurred in Brazil on 11-12 January, when a flash flood, caused by rainfall which exceeded 200 millimetres in a few hours, in mountainous terrain about 60 kilometres north of Rio de Janeiro caused at least 900 deaths. This was one of the worst natural disasters in Brazil’s history.
Persistent above-normal rainfall through the summer months caused widespread flooding in both eastern Australia and southern Africa. In southern Africa, rainfall from January-March 2011 was two to four times average over many parts of a region encompassing Zimbabwe, Botswana, Namibia, Angola and northern South Africa, and flooding occurred on several occasions. Rainfall for the 12 months from July 2010 to June 2011 was more than double the average over northwestern parts of South Africa. In Australia, the period from September 2010 to March 2011 was the wettest on record (100% above average), with many southeastern areas having the wettest summer on record. There was widespread flooding in eastern Australia, especially from late December to early February, with the worst-affected areas being southeast Queensland and northern Victoria. The city of Brisbane had its worst floods since 1974 with many riverside properties inundated. The heavy rains of late 2010 and early 2011 ended long-term drought conditions in south-eastern Australia, whilst near-normal winter rainfall also eased severe drought conditions which had persisted into the early months of 2011 in the southwest of Western Australia.
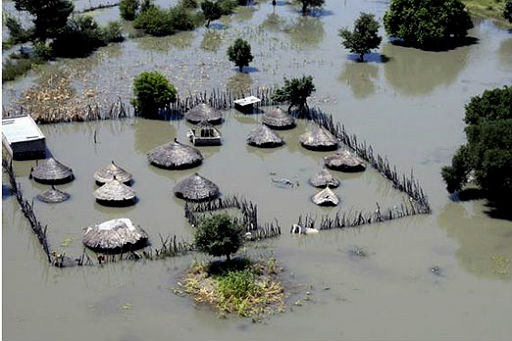
For the second year in succession, Pakistan experienced severe flooding in 2011. The floods were more localised than in 2010, being largely confined to the southern part of the country. It was the wettest monsoon season on record for the province of Sindh (247% above normal). Most of the rain fell in a four-week period from mid-August to early September, with some stations receiving more than 1100 millimetres during this time. Monsoon rainfall was also well above average in western border areas of India, with some flooding, but below average in the north-east; June-September rainfall for India as a whole was 2% above average.
Central America experienced major flooding in October, exacerbated by heavy rains from a tropical depression. 1513 millimetres of rain fell in Huizucar, El Salvador in the 10-day period from 10-20 October. The worst floods were in El Salvador, but Guatemala, Nicaragua, Honduras and Costa Rica were also affected. At least 105 deaths were attributed to the floods. Earlier in the year, consistently above-average rainfall in the first half of the year resulted in floods in northwestern South America, especially Colombia and Venezuela, although conditions were less extreme than they had been at the end of 2010. Bogota received 773 millimetres of rain in the first half of 2011, 67% above average.
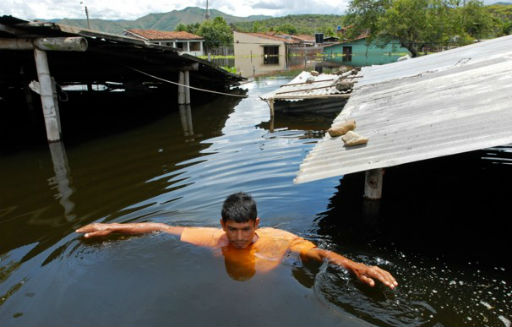
In eastern Asia, tropical cyclones caused flooding in several parts of the region, particularly in Japan in September as a result of Talas and Roke. Talas was responsible for a 72-hour rainfall of 1652.5 millimetres at Kamikitayama in Nara Prefecture, a Japanese record. The Korean peninsula had more consistent rainfall through the summer. It was the wettest summer on record for the Republic of Korea with a national average of 1048 millimetres (44% above the 1973-2011 average). Seoul had 1131 millimetres in July alone (187% above the 1908-2011 average), its second-wettest month on record, and 1702 millimetres for the summer (91% above the 1908-2011 average); there were substantial floods in the city in late July.

Flooding also affected a number of countries, including France, Italy, Spain, Tunisia and Algeria in the western and central Mediterranean during October and November, with loss of life in Italy, Spain and Algeria. Two separate events in north-western Italy in late October and early November each produced rainfalls in excess of 400 millimetres in a few hours, with Spezzino receiving 472 millimetres in six hours on 25 October, while rainfall totals for the period 1-9 November exceeded 900 millimetres at some locations in south-eastern France.
Dry conditions in Europe and eastern China
Following the exceptionally cold conditions of December 2010, temperatures returned to above normal levels in most of Europe (except the northeast) from January onwards. Dry conditions developed in western Europe early in the year and the drought intensified during the spring. It was the driest spring on record over many parts of western Europe, and set national records in France and the Netherlands. Some stations in France and the United Kingdom had less than 20 millimetres for the season. It was also a very warm spring. France (2.5°C above average), the United Kingdom (2.1°C above average), Spain (2.3°C above average) and Switzerland (3.5°C above average) all had their warmest spring on record, whilst Germany and Belgium had their second-warmest spring. Parts of the Alps had their earliest spring snowmelt on record. Rainfall returned to near- to above-average levels during the summer, before turning dry again during the autumn. In some areas the summer was very wet; the Netherlands followed its driest spring on record with its wettest summer, Norway also had its wettest summer on record, and record summer rainfalls also occurred in many parts of Denmark and northeast Germany.
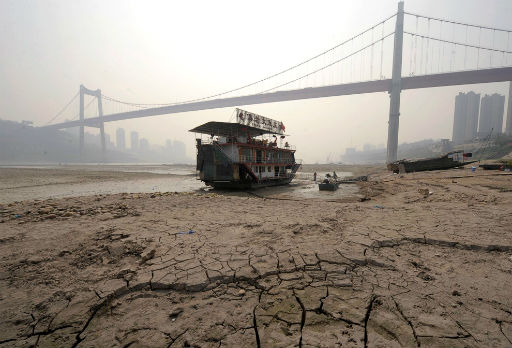
Severe drought which affected parts of eastern China in late 2010 continued into the early months of 2011. It was especially dry in the lower Yangtze basin, where the January-May rainfall was 202 millimetres, 53% below average and well below the previous record of 320 millimetres. From June onwards the dry conditions in this region were replaced by above-average rainfall, with some flooding in places, but further south in China rainfall during the summer monsoon season was well below average. The January-October rainfall in Hong Kong was 1388 millimetres, 40% below average.
Drought, associated with the ongoing La Niña event, affected parts of the tropical western and central Pacific. Tuvalu and Tokelau were amongst the worst affected. Tuvalu was especially severely affected; by October drinking water supplies had to be brought in from outside the country on barges as domestic supplies reached critically low levels.
Below-average tropical cyclone activity
Global tropical cyclone activity was again below average in 2011, although not to the same extent as in 2010, which had the lowest number of tropical cyclones since satellite records began in the late 1960s. As of 22 November there had been 69 tropical cyclones in 2011, compared with the long-term full-year average of 84.
It was an exceptionally quiet season in the Southwest Indian Ocean (west of 90°E), with only 2 cyclones in 2011, and 3 in the full 2010-11 season, the second-lowest number of the last 50 years. Over the full South Indian Ocean there were 7 cyclones, about half the average number.
The only basin to experience significantly above-normal cyclone activity was the North Atlantic, with 19 cyclones (long-term average 11). A disproportionately large number of these cyclones were relatively weak, with the number of hurricanes being close to normal (6 hurricanes, 3 of which reached category 34 or higher). In contrast, the Northeast Pacific had a below-average number of cyclones, but most of those which did form reached hurricane intensity, resulting in a near-average number of hurricanes. In the other basins (Northwest Pacific, South Pacific, North Indian), the total number of cyclones was close to average, but all 4 cyclones in the North Indian basin were minimal tropical storms which did not last more than one day. No tropical cyclones have formed in the Bay of Bengal so far in 2011.
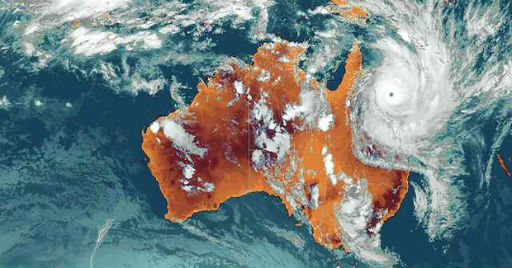
By the standards of recent years there were few destructive landfalls by intense tropical cyclones, although cyclones contributed to major flooding in several parts of the world. The year’s most intense landfall was that of Yasi in early February: it was a category 4 system when it made landfall at Mission Beach (between Townsville and Cairns), making it the most intense system at landfall on the east coast of Australia since at least 1918. Only one death was attributed to Yasi but property damage exceeded US$1 billion. Other systems of comparable peak intensity, all of which weakened before landfall, were Songda (May), Muifa (July) and Nanmadol (August), all of which peaked east of the Philippines. Another damaging landfall event was that of Irene, a category 1 cyclone which struck the northeastern United States in late August and caused in excess of US$7 billion in damage, mostly from flooding.
WMO released its annual Greenhouse Gas Bulletin 21 November. It is available at
WMO Global Atmosphere Watch Programme Web page: http://www.wmo.int/gaw

Forgetting about the three gorges dam are we? After all its the worlds biggest and upriver from the dried up Yangtze you show. Plus the world is a vast and varied place, and statistics incredibly open to manipulation – you can bet record regional weather has happened somewhere, sometime, every year since the earth began.