
Significant sea surface temperature events in 2016 explained
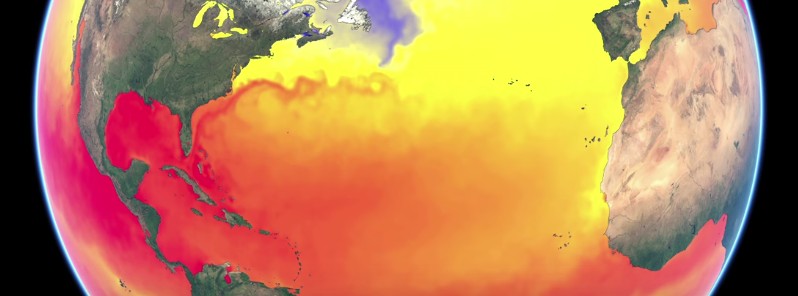
Image credit: EUMETSAT
Anne O'Carroll, Remote Sensing Scientist at EUMETSAT, talks us through this mesmerizing animation describing a year of sea surface temperature (SST) in 2016. The animation combines satellite data from both the geostationary ring of satellites and polar orbiting data including from Europe, America, and Japan.
Anne goes through each month of the year highlighting specific weather events, currents and changes in temperatures in different zones of the Earth focussing especially on El Niño–Southern Oscillation (ENSO) and La Niña.
"The animation is important to see the changes on a global scale of the surface temperatures of our ocean and to consider how these influence weather patterns and thus our daily lives. Moreover, the compilation of the voiceover was an interesting opportunity to put these changes into context," Anne said.
El Niño is a natural cycle in Pacific Ocean temperatures, winds, and cloud that influences climate all around the planet. It consists of a band of warm water developing in the central and east-central equatorial Pacific. On the other hand, La Niña is the “cool” phase that follows El Niño, bringing colder temperatures.
In February (image 1 and minute 00.46) we can see El Niño conditions in the El Niño 3.4 region with sea surface temperatures at more than ½ degree above average conditions. In April the strength of El Niño is fading and we can see cooler temperatures moving westward in the Central Pacific (Image 2 and minute 02.50).
Moving into summer, El Niño conditions reach the neutral state with sea surface temperatures getting gradually cooler (04.15). Finally, from October onwards we can see La Niña conditions where sea surface temperatures in the El Nino 3.4 region are 0.5 degrees colder than usual (05.50).
As seasons change, colder temperatures are colored in blue while warmer surface temperatures evolve from yellow to magenta, and while currents move we can see the changes in temperatures twirling around.
"The animation shows the beauty of the movement of our ocean and the changes in temperature and how energy is distributed and spreads around our globe, affecting the weather, climate, ecosystem and all our daily lives," Anne said.
Video courtesy EUMETSAT
The Watchers team and our contributors bring the latest on extreme weather, earthquakes, volcanic eruptions, space weather, and all things science. We're all about making sense of the natural world and keeping you informed on what’s happening. Got a tip or a question? Hit us up using the form at newstips!
Commenting rules and guidelines
We value the thoughts and opinions of our readers and welcome healthy discussions on our website. In order to maintain a respectful and positive community, we ask that all commenters follow these rules.