
Inside the “South Napa” M6.0 earthquake
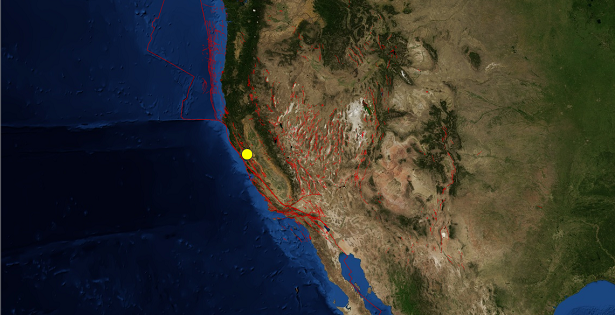
Image credit: Powered by Leaflet — Tiles Courtesy of MapQuest — Portions Courtesy NASA/JPL-Caltech and U.S. Department of Agriculture, Farm Service Agency
On August 24, 2014, the northern San Francisco Bay Area was struck by the largest earthquake to impact the Bay Area since the 1989 M6.9 Loma Prieta earthquake. "South Napa" M6.0 earthquake occurred west of mapped traces of the West Napa Fault, the most seismically active of the faults mapped between the longer Rodgers Creek Fault on the west and the Concord-Green Valley Fault to the east. USGS reported epicenter 6 km (4 miles) NW of American Canyon and 8 km (5 miles) SSW of Napa, California at depth of 11.3 km (7 miles).
.jpg)
USGS shakemap (Credit: USGS)
Strong M6.0 earthquake caused significant damage in south Napa County. Damage is localized in the region surrounding Napa due to the rupture directivity to the north-west. River valley sediments in Napa Valley likely contributed to the amplification of shaking around Napa.

USGS PAGER data (Credit: USGS)
Governor Edmund G. Brown Jr. issued an emergency proclamation extending relief to Napa, Solano, and Sonoma counties due to the effects of a M6.0 earthquake in Napa Valley that have damaged homes, businesses, and caused the closure of some roads and highways. More than 100 people suffered injuries, six remained in critical condition.
Drone aerial clips showing a unique look at the major damage in downtown Napa caused by the earthquake on August 24, 2014. (Credit: Evan K/youtube)
Northern California Seismic System (NCSS) operated by UC Berkeley and USGS reported on August 26, 2014 the probability of a strong and possibly damaging aftershock in the next seven days is approximately 14 %, while 5 to 10 % probability of an earthquake equal to or larger in the same period.
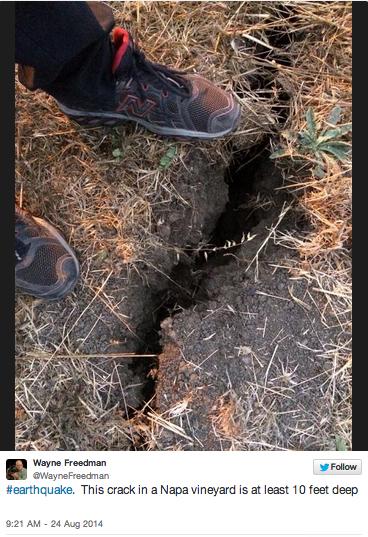
USGS and California Geological Survey (CGS) geologists mapped surface rupture produced by the earthquake from the epicenter NNW at least 10 km (6 miles) on a previously mapped strand of the West Napa Fault. At that point the surface rupture may have jumped eastward about half a mile toward Napa and extended NNW another few miles along a previously unmapped strand of the West Napa Fault. USGS analysis of the seismic recordings indicates the earthquake rupture propagated to the NNW and upward, directing the brunt of the earthquake energy to the NNW towards Napa. The surface ruptures show a northward shift west of the West Napa fault of about two inches.
GPS receivers operated by the USGS and others also measured a shift of the earth of a few inches caused by the earthquake.
The 1999 Working Group on California Earthquake Probabilities (WG99, 1999) concluded that the Hayward-Rodgers Creek Fault system has a 32 % probability of generating a large earthquake (M6.7 to 7.4) by the year 2030, and the Concord-Green Valley Fault system has a 6 % chance of generating a large earthquake (M≥6.7) in the same time period.
Tectonic Summary
The earthquake lies within a 70-km-wide (44 miles) set of major faults of the San Andreas Fault system that forms the boundary between the Pacific and North American tectonic plates. The persistent northwestward movement of the Pacific plate relative to North America primarily causes right-lateral slip across the major faults, but also causes deformation between the major faults. The ongoing complex deformation field is revealed by modern geodetic surveys and earthquake patterns as well as the regional geologic structure. The earthquake is located at the eastern shore of San Pablo Bay between two major active fault systems: the Hayward-Rodgers Creek Fault system on the west and the Concord-Green Valley Fault system on the east. The earthquake occurred near the well-known West Napa Fault, and the less well known Carneros-Franklin Faults, which juxtapose different suites of rocks. Although there are several faults in the region of the earthquake, only the West Napa Fault is known to have displaced Holocene-age sediment — which is positive evidence of surface fault rupture in the last 11,000 years.

California seismicity – 1973-present /Credit: USGS)
Historically, in this region shaking sufficient to seriously damage structures at Mare Island occurred during the M6.8 1868 Hayward Fault earthquake, the M7.8 1906 San Andreas Fault earthquake, and particularly during the M6.3 1898 Mare Island earthquake. The 1898 earthquake may have occurred about 20 km (12 miles) to the northwest on the southern Rodgers Creek Fault. Even larger nearby events than the 1898 earthquake can be expected in the future. In addition, the epicentral region of this earthquake is depicted on the USGS National Seismic Hazard Maps to have a high probability of strong shaking in the future.
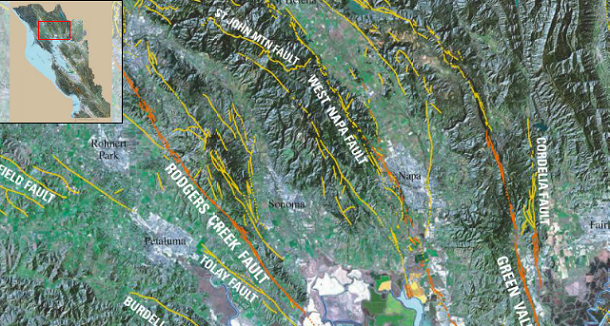
Quaternary map of the San Francisco Bay Area fault systems (Credit: USGS/California Geological Survey)
The earthquake is located between two major, largely strike-slip fault systems. The Hayward-Rodgers Creek Fault system, which is approximately 7 km (4 miles) west of the site, generated damaging earthquakes in 1868 and probably in 1898. The Concord-Green Valley Fault system, which is 12 km (7 miles) east of the site, produced a M5.5 earthquake in 1954; while it has not generated a large historical event, there is strong evidence for recent pre-historic activity. The 1999 Working Group on California Earthquake Probabilities (WG99, 1999) concluded that the Hayward-Rodgers Creek Fault system has a 32 percent probability of generating a large earthquake (M6.7 to 7.4) by the year 2030, and the Concord-Green Valley Fault system has a 6 percent chance of generating a large earthquake (M≥6.7) in the same time period.
The earthquake occurred near the north shore of San Pablo Bay. The bayshore areas in the San Francisco Bay region are underlain by landfill and bay mud and have experienced disproportionately greater damage during historic earthquakes. Such damage is caused by soil failure in the fills and amplification of ground shaking by the soft bay mud.
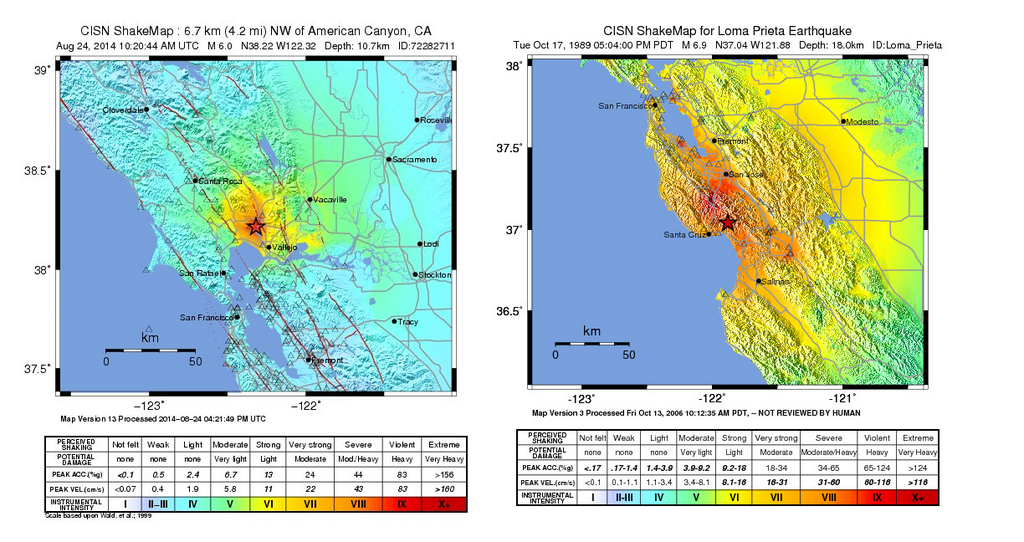
Compared shakemaps of 2014 South Napa M6.0 and 1989 Loma Prieta M6.9 earthquakes. (Credit: USGS)
Commenting rules and guidelines
We value the thoughts and opinions of our readers and welcome healthy discussions on our website. In order to maintain a respectful and positive community, we ask that all commenters follow these rules.