
Unreported sources of sulfur dioxide found by satellites
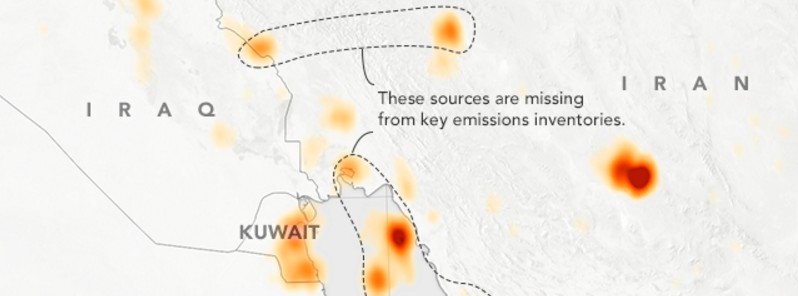
Image credit: NASA Earth Observatory map by Joshua Stevens, using OMI data courtesy of Chris McLinden, et al. (2016). Caption by Ellen Gray, NASA Earth Science News Team, with Mike Carlowicz.
Using a new satellite-based method, scientists have located 75 natural and 39 unreported and major manmade sources of sulfur dioxide (SO2) emissions. When released into the atmosphere, sulfur dioxide forms sulfuric acid and fine particulate matter, secondary pollutants that have significant adverse effects on human health, the environment, and the economy.
To develop comprehensive and accurate inventories, industries, government agencies, and scientists can now use satellites to help them pinpoint some of the previously missing sources of SO2.
“We have an independent measurement of these emission sources that does not rely on what was known or thought to be known,” said Chris McLinden, an atmospheric scientist with Environment and Climate Change Canada and lead author of the study published on June 2 in Nature Geosciences. “When you look at a satellite picture of sulfur dioxide, you end up with it appearing as hot spots—bull’s-eyes, in effect—which make the estimates of emissions easier.”
Credit: NASA / Aura – OMI; EO. Acquired 2007 – 2009
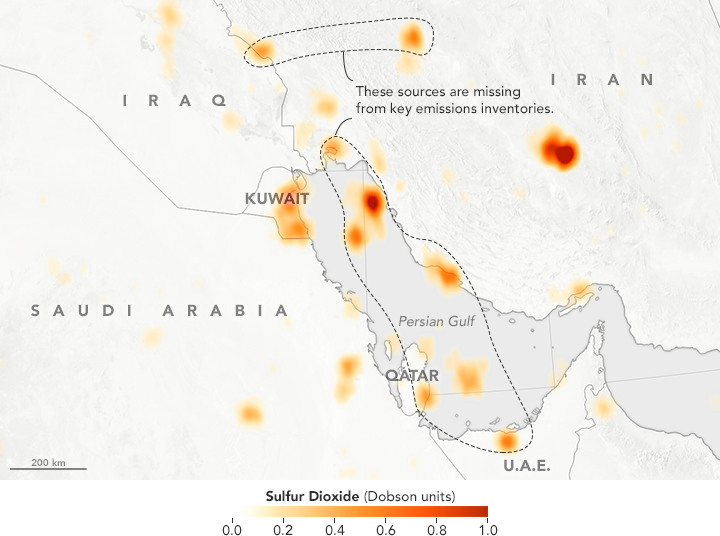
The map above shows a regional picture of sulfur dioxide emissions as detected by the Dutch-Finnish Ozone Monitoring Instrument (OMI) on NASA’s Aura spacecraft. In the analysis of data from 2005 to 2014, McLinden and colleagues found 39 previously unreported emission sources. Among them were clusters of coal-burning power plants, smelters, and oil and gas operations, most notably in the Middle East, but also in Mexico and parts of Russia.
Also, the satellite measurements of emissions from some known sources were two to three times higher than what is being reported in ground-based estimates. Altogether, the unreported and underreported sources account for about 12 percent of all manmade emissions of sulfur dioxide, McLinden noted—a discrepancy that can have a large impact on regional air quality.
The research team also located 75 natural sources of sulfur dioxide, many of them non-erupting volcanoes that slowly leak the gas throughout the year. While not necessarily unknown, many of these volcanic sources are in remote locations and not routinely monitored, so this satellite-based data set is the first to provide regular annual information on passive volcanic emissions.
“Quantifying the sulfur dioxide bull’s-eyes is a two-step process that would not have been possible without two innovations in working with the satellite data,” said co-author Nickolay Krotkov, an atmospheric scientist at NASA’s Goddard Space Flight Center.
The first innovation was an improvement in the computer processing that transforms raw satellite observations from OMI into precise estimates of sulfur dioxide concentrations. Krotkov and his team can now more accurately detect smaller sulfur dioxide concentrations, including those emitted by oil-related facilities and medium-sized power plants.
McLinden and his colleagues also used a new computer program to more precisely detect sulfur dioxide after it had been dispersed and diluted by winds. They combined those data with model estimates of wind strength and direction to trace pollutants back to their sources.
Abstract of the paper
Sulfur dioxide is designated a criteria air contaminant (or equivalent) by virtually all developed nations. When released into the atmosphere, sulfur dioxide forms sulfuric acid and fine particulate matter, secondary pollutants that have significant adverse effects on human health, the environment, and the economy. The conventional, bottom-up emissions inventories used to assess impacts, however, are often incomplete or outdated, particularly for developing nations that lack comprehensive emission reporting requirements and infrastructure. Here we present a satellite-based, global emission inventory for SO2 that is derived through a simultaneous detection, mapping and emission-quantifying procedure, and thereby independent of conventional information sources. We find that of the 500 or so large sources in our inventory, nearly 40 are not captured in leading conventional inventories. These missing sources are scattered throughout the developing world—over a third are clustered around the Persian Gulf—and add up to 7 to 14 Tg of SO2 yr−1, or roughly 6–12% of the global anthropogenic source. Our estimates of national total emissions are generally in line with conventional numbers, but for some regions, and for SO2 emissions from volcanoes, discrepancies can be as large as a factor of three or more. We anticipate that our inventory will help eliminate gaps in bottom-up inventories, independent of geopolitical borders and source types.
References:
- "Space-based detection of missing sulfur dioxide sources of global air pollution" – Chris A. McLinden, Vitali Fioletov, Mark W. Shephard, Nick Krotkov, Can Li, Randall V. Martin, Michael D. Moran & Joanna Joiner – Nature Geoscience (2016) – doi:10.1038/ngeo2724
- "Satellite Finds Unreported Sources of Sulfur Dioxide " – article published on June 7, 2016 by NASA's Earth Observatory
The Watchers team and our contributors bring the latest on extreme weather, earthquakes, volcanic eruptions, space weather, and all things science. We're all about making sense of the natural world and keeping you informed on what’s happening. Got a tip or a question? Hit us up using the form at newstips!
Commenting rules and guidelines
We value the thoughts and opinions of our readers and welcome healthy discussions on our website. In order to maintain a respectful and positive community, we ask that all commenters follow these rules.