
First decade of 21st century: unprecedented high-impact climate extremes since measurements began!

Image credit: Sunset variations by http://www.flickr.com/photos/66521457@N03/9209601874
According to World Meteorological Organization (WMO) report The Global Climate 2001-2010, A Decade of Extremes Earth experienced unprecedented high-impact climate extremes in 2001 – 2010 since the measurements began in 1850. In that period more national temperature records were broken than in any other decade.
The first decade of the 21st century was the warmest for both hemispheres and for both land and ocean temperatures. High temperatures were accompanied by a rapid decline in Arctic sea ice, and an accelerating loss of the ice sheets of the world's glaciers.
Earth experienced above-average precipitation, including one year – 2010 – that broke all previous records. 2001 – 2010 period was also marked by dramatic climate and weather extremes such as the European heatwave of 2003, the 2010 floods in Pakistan, hurricane Katrina in the United States of America (USA), cyclone Nargis in Myanmar and long-term droughts in the Amazon Basin, Australia and East Africa.
Extreme floods, droughts and tropical cyclones were all experienced across the world and throughout the decade. More than 370,000 people died as a result of these, representing a 20 per cent increase in casualties from the previous decade. This increase is due mainly to the dramatic increase in the total reported deaths arising from heatwaves in 2003 and 2010.
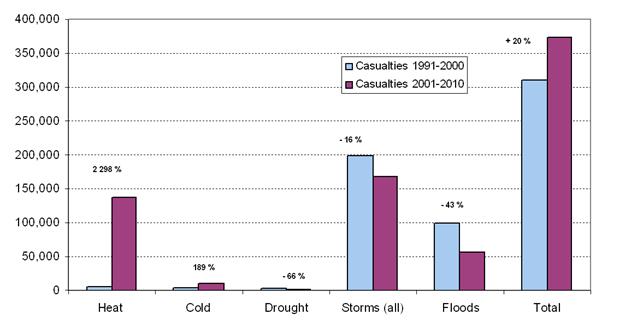
Impact of Extreme events during 2001-2010 compared with 1991-2000. Total number of loss of lives
Temperatures
The average land and ocean-surface temperature for the decade 2001-2010 was estimated to be 14.47°C, or 0.47°C above the 1961–1990 global average and +0.21°C above the 1991–2000 global average (with a factor of uncertainty of ± 0.1°C).
The decadal rate of increase in the global temperature accelerated between 1971 and 2010. The global temperature increased at an average estimated rate of 0.17°C per decade during that period, compared with 0.062°C per decade for the entire 1880-2010 period. The average 2001-2010 decadal temperature was 0.21°C warmer than 1991–2000, which in turn was +0.14°C warmer than 1981-1990.
Every year of the decade except 2008 was among the 10 warmest years on record. The warmest year ever recorded was 2010, with a temperature estimated at 0.54°C above the 14.0°C long term average of 1961-1990 base period, followed closely by 2005.
Above-average temperatures were observed over most parts of the globe in 2001-2010. This was particularly marked in the higher latitudes of the northern hemisphere. Greenland recorded the largest decadal temperature anomaly, at +1.71°C above the long-term average and with a temperature in 2010 of +3.2°C above average. Africa experienced warmer than normal conditions in every year of the decade.
Decadal global combined surface-air temperature over land and sea-surface temperature (°C) obtained from the average over the three independent datasets maintained by the HadCRU, NOAA-NCDCand NASA-GISS.The Horizontal grey line indicates the long term average value ( 14°C).
Results from WMO’s survey showed that nearly 94% of reporting countries had their warmest decade in 2001-2010 and no country reported a nationwide average decadal temperature anomaly cooler than the long term average.
Some 44% of countries in the survey reported nationwide hottest temperature records in 2001-2010, compared to 24% in 1991-2000. Coldest daily minimum temperature absolute records showed an opposite pattern: In 1961-1970, nearly 32 % of the countries reported nationwide lowest minimum temperature values. The percentage decreased to 11% in 2001-2010.
Droughts
Drought affected more people than any other kind of natural disaster due to their large scale and long-lasting nature. Some of the highest-impact and long-term droughts struck Australia (in 2002 and other years), East Africa (2004 and 2005, resulting in widespread loss of life) and the Amazon Basin (2010) with negative environmental impacts.
Flooding and heavy precipitation
Numerous high-impact flooding and heavy precipitation events were recorded during the decade. WMO devoted special case study to the large-scale flooding event which occurred in Pakistan in July 2010. It affected more than 20 million people and claimed some 2 000 casualties.
The 2001-2010 decade was the second wettest since 1901. Globally, 2010 was the wettest year since the start of instrumental records.
Most parts of the globe had above-normal precipitation during the decade. The eastern USA, northern and eastern Canada, and many parts of Europe and central Asia were particularly wet.
According to the WMO survey, floods were the most frequently experienced extreme events over the course of the decade. Eastern Europe was particularly affected in 2001 and 2005, India in 2005, Africa in 2008, Asia (notably Pakistan, where 2 000 people died and 20 million were affected) in 2010, and Australia, also in 2010.
According to the 2011 Global Assessment Report, the average population exposed to flooding every year increased by 114% globally between 1970 and 2010, a period in which the world’s population increased by 87% from 3.7 billion to 6.9 billion.
Heatwaves
Anomalously warm weather that lasts for several days or weeks and has a severe impact on society is often referred to as a heatwave. Extreme heatwaves occurred in Europe in summer 2003 (more than 66 000 deaths in France, Germany, Italy, Portugal and Spain, together) and in the Russian Federation in 2010 (more than 55 000 related deaths).
Severe storms
More than 500 cyclone-related disaster events were recorded killing nearly 170,000 people, affecting over 250 million, and caused estimated damages of $380 billion. The number of people exposed to severe storms almost tripled in cyclone-prone areas, increasing by 192%, in the same period.
According to NOAA-NCDC, 2001 – 2010 was the most active decade since 1855 for tropical cyclones in the North Atlantic Basin. An average of 15 named storms per year was recorded, well above the 1981 -2010 long-term average of 12 named storms per year. The most active season ever recorded was 2005, with a total of 27 named storms, of which 15 reached hurricane intensity and seven were classified as major hurricanes (Category 3 or higher).
The North Indian Ocean saw the deadliest tropical cyclone recorded during the decade, when Tropical Cyclone Nargis struck Myanmar in early May 2008. More than 138 000 people were reported killed or missing, eight million people were affected and thousands of homes were destroyed.
Composition of the atmosphere
In addition to analyzing global and regional temperatures, it also charted the rising atmospheric concentrations of greenhouse gases, finding that global concentrations of carbon dioxide in the atmosphere rose by 39 per cent since the start of the industrial era in 1750, nitrous oxide concentrations rose by 20 per cent and methane concentrations more than tripled.
According to the WMO Greenhouse Gas Bulletin, global-average atmospheric concentrations of carbon dioxide rose to 389 ppm1 in 2010 (an increase of 39 per cent compared to pre-industrial times), methane to 1 808.0 ppb1 (158 per cent) and nitrous oxide to 323.2 ppb (20 per cent). This changing composition of the atmosphere is causing the global average temperature to rise, which, in turn, exerts a significant influence on the hydrological cycle and leads to other changes
in climate and weather patterns.
Humanity's emissions of chlorofluorocarbons and other chemicals have also changed the atmosphere by damaging the stratospheric ozone layer that filters out harmful ultraviolet radiation.
Cryosphere
The record warmth of the decade was accompanied by the melting of ice caps, sea ice and glaciers and the thawing of permafrost. In addition to being a sign of a warming climate, melting ice and snow also affected water supplies, transport routes, infrastructure, marine ecosystems much more.
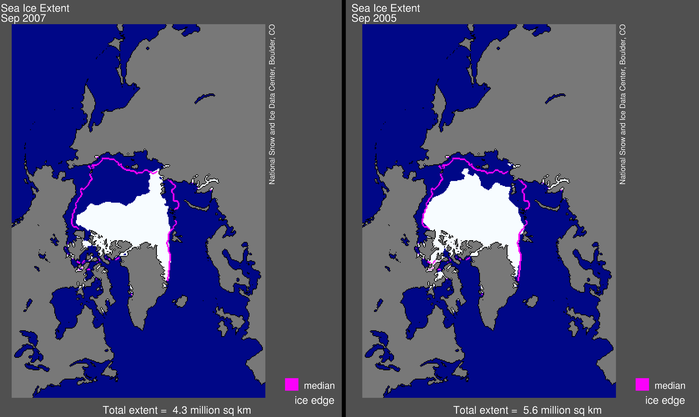
This image compares the average sea ice extent for September 2007 to September 2005; the magenta line indicates the long-term median from 1979 to 2000. September 2007 sea ice extent was 4.28 million square kilometers (1.65 million square miles), compared to 5.57 million square kilometers (2.14 million square miles) in September 2005. This image is from the NSIDC Sea Ice Index. Image courtesy of the National Snow and Ice Data Center, University of Colorado, Boulder.
The sea ice in the Arctic Ocean dropped below the previous all-time record set in 2007. This year also marks the first time that there has been less than 4 million square kilometers (1.54 million square miles) of sea ice since satellite observations began in 1979. This animation shows the 2012 time-series of ice extent using sea ice concentration data from the DMSP SSMI/S satellite sensor. The black area represents the daily average (median) sea ice extent over the 1979-2000 time period. Layered over top of that are the daily satellite measurements from January 1 — September 14, 2012. A rapid melt begins in July, whereby the 2012 ice extents fall far below the historical average. The National Snow and Ice Data Center (www.nsidc.org) will confirm the final minimum ice extent data and area once the melt stabilizes, usually in mid-September.
The report concludes that understanding the Earth's climate and trends in temperature, precipitation and extreme events is of vital importance to human well being and sustainable development. As the report confirms, climate scientists can now link some natural oscillations to seasonal climate trends. They also understand the mechanisms by which humanity's greenhouse-gas emissions are raising global average temperatures.
While climate scientists believe that it is not yet possible to attribute individual extremes to climate change, they increasingly conclude that many recent events would have occurred in a different way – or would not have occurred at all – in the absence of climate change. (WMO)
In this overview of WMO publication we provided only a glimpse at the extreme climate conditions Earth has experienced in the first decade of 21st century. Many scientists still argue as to why this weather extremes are happening; whether growing human civilization is the source of extreme weather events or they are just the part of natural occurring process. For more facts WMO released please read the summary or the full report for even more data. Links are provided below.
I'm a dedicated researcher, journalist, and editor at The Watchers. With over 20 years of experience in the media industry, I specialize in hard science news, focusing on extreme weather, seismic and volcanic activity, space weather, and astronomy, including near-Earth objects and planetary defense strategies. You can reach me at teo /at/ watchers.news.
I totally Agree. The UK population has voted to BREXIT the “Big Brother EU Superstate” freeing itself from the shackles and EU policies forced on the UK by large controlling Corporate Businesses/Bankers who “OWN” the EU. They are interested only in profit AND, at any cost ! The EU’s policies directly disrespects, disrupts and is destroying
mother nature’s balance and everyone and everything on our planet – in spite, of what they tell us ! This “EU Closed Corporate Club” enslaves mother nature, nations and ALL human beings. Because of EU policies, those of us inside the EU are enslaved and Indebted, AND, those outside are Enslaved, Indebted, Endangered, Impoverished, and forced into starvation worldwide !
These “Corporate Big Brother Bullies” want to enslave us all ! They intend to bind the “EU Superstate” with our brothers and sisters in the “US Superstate” which now also consists of Canada & Mexico, did you know that ? by enacting a Transatlantic Trade Treaty named CETA and TTIP. Research it yourself ! VISIT: http://www.stop-ttip.org. Once
researched properly, join the millions that have signed the petition like I did. This world is currently, corrupt, damaged and dying. BUT, we don’t have to accept this, alternatives exist ! – VISIT: http://www.thenextsystem.org – get involved, get going and start changing our world/planet for the better !
They mention the Arctic, but not the Antarctic. (Wasn’t this supposed to be global warming?)
Without a cause-and-effect link this isn’t science, it isn’t journalism, and we don’t need more state-funded propaganda.
Catalyst for regulation of energy use and bigger government perhaps?
Paul, checkout the article on "global warming" it's all been debunked… as science often is