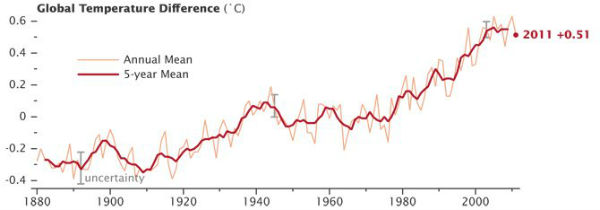
2011 is ninth-warmest year on record

According to new study released by NASA scientists, the global average surface temperature in 2011 was the ninth warmest since 1880. The average temperature around the globe in 2011 was 0.92 degrees F (0.51 C) warmer than the mid-20th century baseline. NASA’s Goddard Institute for Space Studies (GISS) in New York, which monitors global surface temperatures on an ongoing basis, released an updated analysis that shows temperatures around the globe in 2011 compared to the average global temperature from the mid-20th century. Earth continues to experience warmer temperatures than several decades ago.
Scientists point that the planet is absorbing more energy than it is emitting resulting a trend toward higher temperatures. Even with the cooling effects of a strong La Niña influence and low solar activity for the past several years, 2011 was one of the 10 warmest years on record. The difference between 2011 and 2010, which was the warmest year in the GISS record is 0.12 C (0.22 degrees F). Because of the large natural variability of climate, scientists do not expect temperatures to rise consistently year after year. However, they do expect a continuing temperature rise over decades. The first 11 years of the 21st century experienced notably higher temperatures compared to the middle and late 20th century. The only year from the 20th century in the top 10 warmest years on record is 1998.

GISS compiled from weather data from more than 1,000 meteorological stations around the world, satellite observations of sea surface temperature and Antarctic research station measurements to create the temperature analysis. They calculate the difference between surface temperature in a given month and the average temperature for the same place during 1951 to 1980. This three-decade period functions as a baseline for the analysis.
Higher temperatures today are largely sustained by increased atmospheric concentrations of greenhouse gases, especially carbon dioxide. These gases absorb infrared radiation emitted by Earth and release that energy into the atmosphere rather than allowing it to escape to space. As their atmospheric concentration has increased, the amount of energy “trapped” by these gases has led to higher temperatures. The carbon dioxide level in the atmosphere was about 285 parts per million in 1880, when the GISS global temperature record begins. By 1960, the average concentration had risen to about 315 parts per million. Today it exceeds 390 parts per million and continues to rise at an accelerating pace.


The resulting temperature record is very close to analyses by the Met Office Hadley Centre in the United Kingdom and the National Oceanic and Atmospheric Administration’s National Climatic Data Center in Asheville, N.C. NASA scientists expect record-breaking global average temperature in the next two to three years because solar activity is on the upswing and the next El Niño will increase tropical Pacific temperatures. The warmest years on record were 2005 and 2010. (NASA)

Thank you for all the detail information you have posted on the various specific global and solar topics.
pretty selective data set you’re using
This is official data from NASA’s GISS. I only showing their numbers, and those numbers are official, I’m not saying that they are true or false but merely present one of the studies at the beginning of the year. You can choose! Accept or not.
Hot? Did you say, Hot?
Last summer here in Texas, I had to keep an oven glove on the front porch to keep the door knob from burning my hand to get into the house.
I walked my dog outside, and my foot got trapped in an earth gap in the ground which caused me to fall. The front half of my foot got caught in it!