
Atmospheric rivers coincide with one-third of large midlatitude floods, global study finds
Atmospheric rivers coincided with about 30–35% of observed large midlatitude floods in a global analysis published in Scientific Reports on August 18, 2026. The best-performing LightGBM model reached ROC AUC 0.94 and 85% accuracy, while modeled flood risk rose sharply when high antecedent soil moisture occurred with persistent atmospheric-river activity.
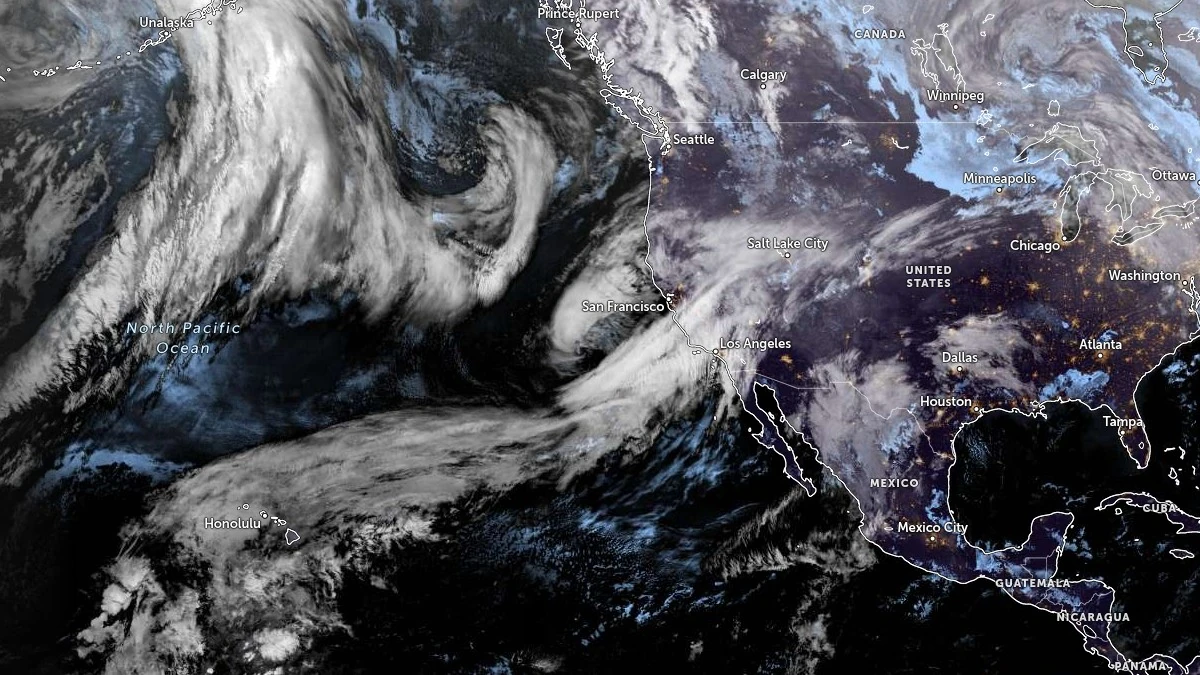
Atmospheric river developing in the Pacific Ocean. Satellite image acquired at 08:40 UTC on February 10, 2026. Credit: NOAA/GOES-West, Zoom Earth, The Watchers
Assaf Shmuel, Oleg Zlydenko, Martin Gauch and Colin Price developed the framework to examine flood occurrence under atmospheric river conditions worldwide
Atmospheric rivers (AR) are narrow corridors of concentrated moisture transport that can replenish water supplies while also producing extreme precipitation, flooding and landslides. Shmuel et al. (2026) found that atmospheric rivers were associated with about one-fifth of large floods globally, rising to roughly 30–35% in the midlatitudes.
Atmospheric rivers occupied a much smaller share of observation time than their share of midlatitude floods. The proportion of floods occurring under atmospheric-river conditions reached as much as four times the atmospheric-river observation-time fraction in some midlatitude bands. Modeled high-flood-risk occurrence was concentrated along coastal and midlatitude regions, where ocean-sourced moisture and terrain can favor heavy precipitation, while atmospheric-river frequency and intensity generally declined farther inland.
The researchers built the classification models from approximately 5 000 balanced observations under atmospheric-river conditions, pairing flood cases with an equal number of cases in which an atmospheric river was present without a recorded flood. Model probabilities and classification scores therefore describe performance within that balanced atmospheric-river-conditioned sample rather than unconditional flood probability at a location.

Physical information entered the framework through atmospheric, hydrological and terrain variables. Inputs included precipitation, soil moisture, total water storage, elevation, relative elevation, atmospheric pressure, humidity, temperature, wind and several atmospheric-river characteristics. Recursive Feature Elimination was used to select the ten strongest inputs. Atmospheric river persistence was measured as the number of hours classified as atmospheric river conditions during the 24 hours preceding an observation.
LightGBM performed best among the nonlinear models tested, reaching ROC AUC 0.94, accuracy 0.85, precision 0.84, recall 0.87 and F1 score 0.85 in leave-one-year-out temporal validation. XGBoost reached ROC AUC 0.92, Random Forest 0.90, H2O Deep Learning 0.87 and K-Nearest Neighbors 0.77, while logistic regression reached 0.81.
Probability calibration also improved when atmospheric river, hydrological and terrain information was included. The full LightGBM model recorded a Brier score of 0.094, compared with 0.204 for a precipitation-only version; lower Brier scores represent better agreement between predicted probabilities and observed outcomes. Full-feature logistic regression produced a score of 0.186.
Independent testing against the satellite-derived Global Flood Database produced ROC AUC 0.95 and 86% accuracy, with precision 0.90, recall 0.82 and F1 score 0.85. Ten-fold cross-validation returned mean ROC AUC 0.95 ± 0.01. A more demanding five-fold spatial-block test, which withheld entire 20° latitude-longitude blocks from training, produced ROC AUC values of 0.84–0.86.
Integrated vapor transport, or IVT, ranked first in the SHAP analysis. IVT measures the magnitude of atmospheric moisture transport by combining its east-west and north-south water-vapor flux components. Precipitation, elevation, soil moisture, slope and total water storage also contributed strongly to model output. The LightGBM model’s separate intrinsic feature-importance measure ranked elevation first.
The balance among predictors varied geographically. Total water storage contributed strongly in Africa and North America, while IVT had a large contribution in Europe and North America. Adjacent precipitation and short-term accumulated precipitation were prominent in Asia and Oceania, and elevation and slope had the largest contributions in South America. The feature analyses measure model sensitivity and contribution to classification output; they do not establish direct hydrological causation.
Antecedent wetness and atmospheric river duration produced one of the clearest nonlinear relationships in the study. Modeled flood risk increased sharply when high soil moisture coincided with a greater number of atmospheric-river hours during the preceding 24 hours. Prolonged moisture delivery over an already wet surface produced higher model probabilities than either condition at lower values.
A California flood on March 21, 2018 provided a case study. The model produced high flood-classification probabilities beginning one day before the event, remained elevated on the day of the flood and stayed elevated for the following two days. The atmospheric river persisted over the affected region during the event, while heavy rainfall, mudslides and flooding displaced thousands of residents.
A separate analysis examined whether atmospheric rivers were disproportionately associated with the largest reported floods. Researchers used Groundsource, an inventory containing 2.6 million flood events extracted from more than 5 million news articles across more than 150 countries. Atmospheric rivers overlapped only 1.5% of all Groundsource flood records, but their representation increased to 30.7% among the largest 1% of records — about 21 times the full-dataset rate.
Groundsource records associated with atmospheric rivers had a median reported geographic extent of 1 869 km² (722 mi²), compared with 1.94 km² (0.75 mi²) for records without atmospheric-river overlap. Mean reported extents were approximately 1 999 km² (772 mi²) and 117 km² (45.2 mi²), respectively. Groundsource areas represent polygons assigned to geographic locations identified in news reports rather than directly measured inundation footprints, so the comparison describes reported geographic extent.
Long-term analysis using consistent reanalysis inputs from 1980 through 2020 found a global increase of more than 10% in model-estimated high-flood-risk atmospheric-river occurrence and a poleward shift in its distribution. High-latitude regions recorded some of the strongest relative increases, including Greenland, where absolute occurrence remained low. Smaller increases appeared across parts of the midlatitudes, while localized decreases occurred elsewhere.
Regional trends within the tropics differed substantially. Atmospheric-river occurrence and model-estimated high-risk conditions declined across tropical parts of the Americas and much of Australia, while tropical Asia and large parts of Africa recorded increases. Atmospheric-river occurrence also increased in some midlatitude inland areas farther from the oceans.
The 1980–2020 trend analysis measures statistical changes in atmospheric-river occurrence and model-estimated high-risk conditions. Formal climate-change attribution was outside the study design. The authors discuss the results alongside previous research on increasing atmospheric moisture in a warmer climate and the poleward migration of storm tracks.
Population analysis using 0.5° grid cells estimated that roughly 90% of the global population lives in regions experiencing at least one atmospheric river annually. The number of people living in those grid cells increased from about 4 billion in 1980 to nearly 7 billion in recent years, with population growth accounting for most of the increase and changes in atmospheric-river occurrence making a smaller contribution.
Several constraints limit interpretation and operational use. The study identifies statistical associations between atmospheric rivers and floods rather than direct causal attribution, and the models group fluvial, flash and coastal floods together. The primary flood dataset, derived from social-media observations, can underrepresent sparsely populated regions, while the satellite-based Global Flood Database can miss smaller or short-duration events. ERA5-derived predictors were used at an effective resolution of about 0.25°, which can smooth localized precipitation extremes associated with urban and flash flooding.
Real-time early-warning use would require forecasts of atmospheric-river trajectories and future intensity, which were outside the model inputs used in the study. The researchers identify forecast integration and higher-resolution hydrological information as areas for further development.
References:
1 Shmuel, A., Zlydenko, O., Gauch, M., & Price, C. (2026). Assessing global flood risk from atmospheric rivers through physically guided machine learning. Scientific Reports. https://doi.org/10.1038/s41598-026-67280-9

I’m a science journalist and researcher at The Watchers, contributing to the Epicenter edition, where I cover peer-reviewed scientific research and emerging discoveries across Earth and space sciences. With a background in astronomy and a passion for environmental science, I’ve worked in shark and coral conservation in Fiji, conducting reef and shark-behavior research, contributing to mangrove restoration, and earning PADI Open Water and Coral Reef Certifications. I bring a blend of scientific rigor and storytelling to illuminate the discoveries shaping our planet and beyond.
Published in the last 24 hours
- In 2017, El Niño rains turned part of Peru's Sechura Desert into a lake more than four times the size of Lake Tahoe, and families went out on wooden rafts to fish it Epicenter
- Green Lake, Hawaii's largest freshwater lake, was gone by the afternoon of June 2, 2018, after lava from Kilauea filled its basin. The water was about 20 feet deep, not the 200 feet often claimed. Epicenter
- A South Dakota man put the widest and heaviest hailstone on US record in his freezer, and a power cut melted part of it before NOAA measured it at 8 inches across and nearly 2 pounds in 2010 Epicenter
- Black kites and brown falcons in northern Australia have been seen snatching smoldering sticks from wildfires, flying them into unburned grass and dropping them, starting new fires that send lizards, rodents and insects running straight toward the waiting birds Epicenter
