
Earthquakes of the first 15 years of the 21st century
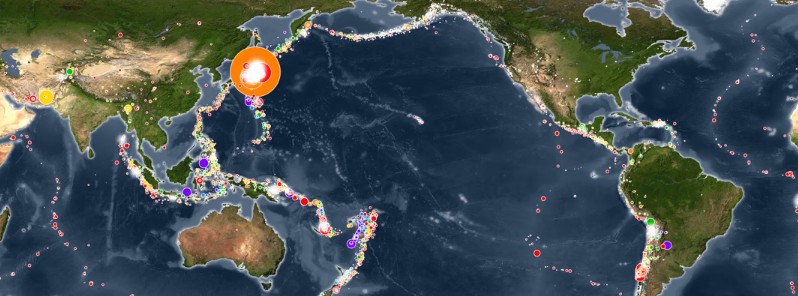
Image credit: NOAA
This animation shows every recorded earthquake in sequence as they occurred from January 1, 2001, through December 31, 2015, at a rate of 30 days per second.
This time period includes some remarkable events. Several large earthquakes caused devastating tsunamis, including M9.1 in Sumatra on December 16, 2004, M8.1 in Samoa on September 29, 2009, M8.8 magnitude in Chile on February 27, 2010, and M9.0 magnitude off of Japan on March 11, 2011.
Like most earthquakes, these events occurred at plate boundaries, and truly large events like these tend to occur at subduction zones where tectonic plates collide. Other, much smaller earthquakes also occur away from plate boundaries such as those related to volcanic activity in Hawaii or those related to wastewater injection wells in Oklahoma.
The earthquake hypocenters first appear as flashes then remain as colored circles before shrinking with time so as not to obscure subsequent earthquakes.
The size of the circle represents the earthquake magnitude while the color represents its depth within the earth.
At the end of the animation, it will first show all quakes in this 15-year period. Next, it will show only those earthquakes greater than magnitude 6.5, the smallest earthquake size known to make a tsunami.
Finally, it will only show those earthquakes with magnitudes of magnitude 8.0 or larger, the “great” earthquakes most likely to pose a tsunami threat when they occur under the ocean or near a coastline and when they are shallow within the earth (less than 100 km or 62 miles deep).
NOAA Science on a Sphere version:
http://sos.noaa.gov/Datasets/dataset….
Earthquake source used: NEIC Earthquake Catalog
http://earthquake.usgs.gov/earthquake…
The Watchers team and our contributors bring the latest on extreme weather, earthquakes, volcanic eruptions, space weather, and all things science. We're all about making sense of the natural world and keeping you informed on what’s happening. Got a tip or a question? Hit us up using the form at newstips!
Amazing! And scary for people who live where there are earthquakes – but I guess we are are at threat of earthquakes. Thank you for making this.
That was incredible. Thanks for posting.