
Revised NOAA forecast predicts stronger Solar Cycle 25, peak in 2024
NOAA’s Space Weather Prediction Center (SWPC) has revised its forecast for Solar Cycle 25, predicting a quicker and more intense peak in solar activity between January and October 2024. The updated prediction challenges the previous expert panel’s forecast from 2019.
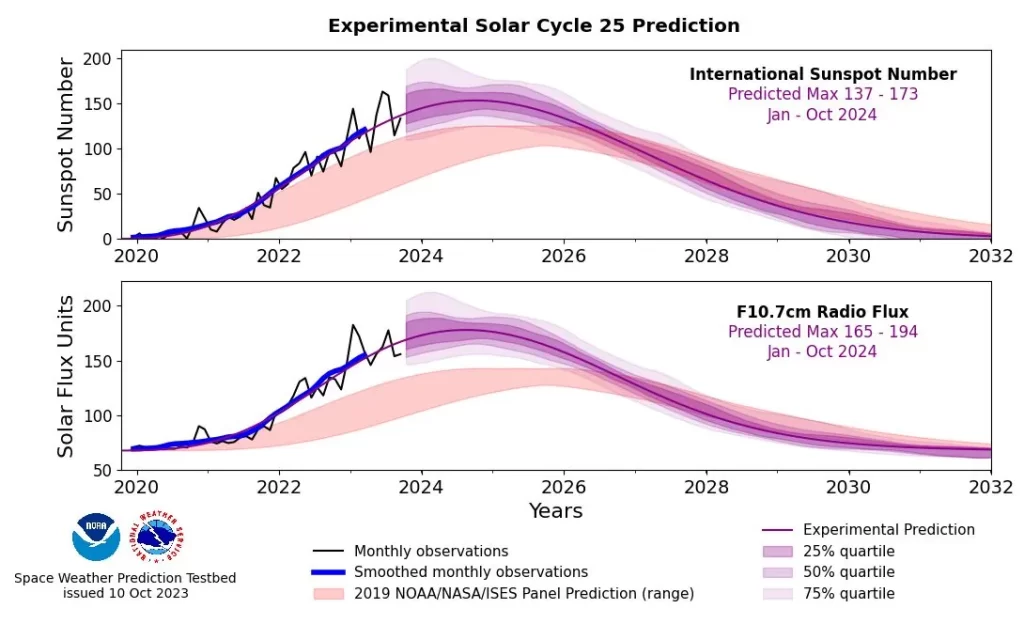
The National Oceanic and Atmospheric Administration’s Space Weather Prediction Center (SWPC) has issued an updated prediction for Solar Cycle 25. The new forecast, revealed this month, anticipates the solar cycle to peak between January and October of 2024, with a maximum sunspot number between 137 and 173. This contradicts the expert panel’s forecast from December 2019, which estimated the peak to occur in July 2025 with a maximum sunspot number of 115.
Mark Miesch, a CIRES scientist and the solar cycle lead at SWPC, stated that the initial forecast for Cycle 25, released in 2019, was no longer reliable for long-term planning. As a remedy, SWPC has unveiled an experimental Updated Solar Cycle Prediction Product. This new product, part of the Space Weather Prediction Testbed website, aims to offer continually updated forecasts based on new sunspot observations.
Solar cycles have significant implications for various technologies and services. For instance, heightened solar activity can disrupt electrical grids, degrade GPS signals, and pose radiation hazards to airline crews and astronauts. Solar Cycle 24, which was weaker than average, had a peak sunspot number of 116. While the new prediction for Solar Cycle 25 is stronger than that for Cycle 24, it would still make it below average, with the average sunspot number standing at 178.
The 2019 panel, comprised of experts from NOAA, NASA, and the International Space Environment Services (ISES), had initially predicted a weak Solar Cycle 25. The discrepancy between the new and old predictions has raised the need for more robust and up-to-date forecasting methods. Accordingly, the updated product from SWPC will be revised monthly, enhancing its reliability for long-term planning.
When it comes to numerical forecasts, the new prediction has several layers of uncertainty. There is a 25% chance that the smoothed sunspot number will fall within a certain dark-shaded region, a 50% chance it will fall in a medium-shaded region, and a 75% chance it will fall in the lightest of the shaded regions. This level of granularity in the forecast is aimed at helping various sectors prepare for potential space weather hazards.
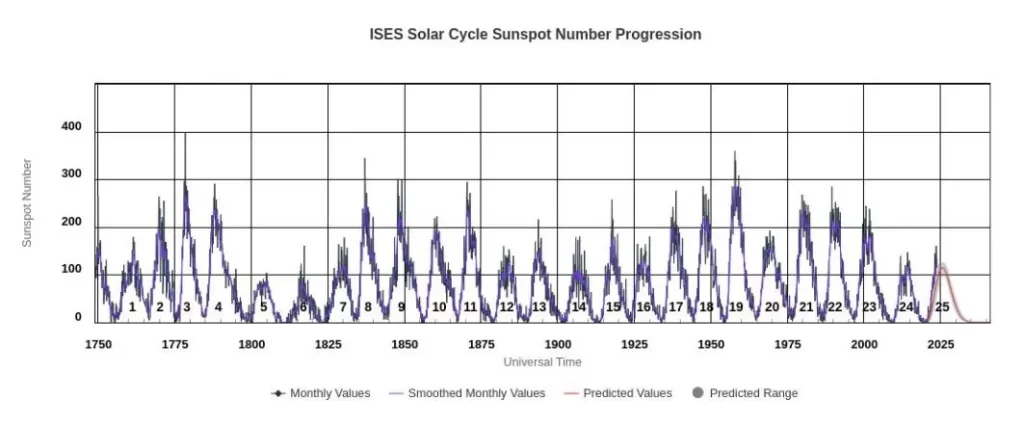
The concept of space weather is closely linked to the broader phenomenon known as space climate, governed by the magnetic activity of the Sun. This activity is not constant but varies in a cyclical manner, approximately every 11 years. These cycles have been studied and numbered since the 18th century, based on observations of sunspots through telescopes. We are currently experiencing Solar Cycle 25, which commenced in December 2019.
Each solar cycle has a peak period known as the Solar Maximum. During this phase, the Sun is particularly active, resulting in an increased frequency and severity of solar storms and associated space weather hazards. These can have a range of impacts on Earth, from affecting satellite operations to disrupting power grids.
While solar cycles exhibit a striking regularity, they are not identical in their intensity or timing. To forecast these aspects, an international panel of experts convened in 2019 to make predictions about Solar Cycle 25. However, these predictions are subject to updates, given the evolving nature of observational data. As a result, the forecast for the strength and timing of Solar Cycle 25 is being updated monthly, based on the latest sunspot data.
The solar cycle’s progression has been monitored for over 180 years by counting the number of sunspots visible on the solar surface each day. These measurements are then averaged monthly and graphed over time. Other measures like the F10.7 radio flux, which is highly correlated with solar activity, also serve as essential metrics for understanding the solar cycle’s progression.
References:
1 NOAA forecasts quicker, stronger peak of solar activity – SWPC – October 25, 2023
2 Solar Cycle Progression Updated Prediction (Experimental) – SWPC – Accessed October 27, 2023
I'm a dedicated researcher, journalist, and editor at The Watchers. With over 20 years of experience in the media industry, I specialize in hard science news, focusing on extreme weather, seismic and volcanic activity, space weather, and astronomy, including near-Earth objects and planetary defense strategies. You can reach me at teo /at/ watchers.news.
Commenting rules and guidelines
We value the thoughts and opinions of our readers and welcome healthy discussions on our website. In order to maintain a respectful and positive community, we ask that all commenters follow these rules.