
Great auroral storms occur every 40 to 60 years, new historical study shows
Image credit: Brett Jordan
A new study published in the Journal of Space Weather and Space Climate suggests that great auroral storms occur about every 40 – 60 years, although the distribution of such events is far from even.
Space weather storms typically have solar, interplanetary, geophysical, and societal-effect components that overlap in time, making it hard for students and novices to determine cause-and-effect relationships and relative timing.
To address this issue, a team of scientists led by Delores Knipp of the University of Colorado Boulder, used timelines to provide context for space weather storms of different intensities.
They presented a timeline and tabular description for the great auroral storms of the last 500 years as an example for space climate.
The graphical summary for these 14 events suggests that they occur about every 40 – 60 years, although the distribution of such events is far from even.
"One outstanding event in 1770 may qualify as a one-in-500-year auroral event, based on duration," the researchers said.
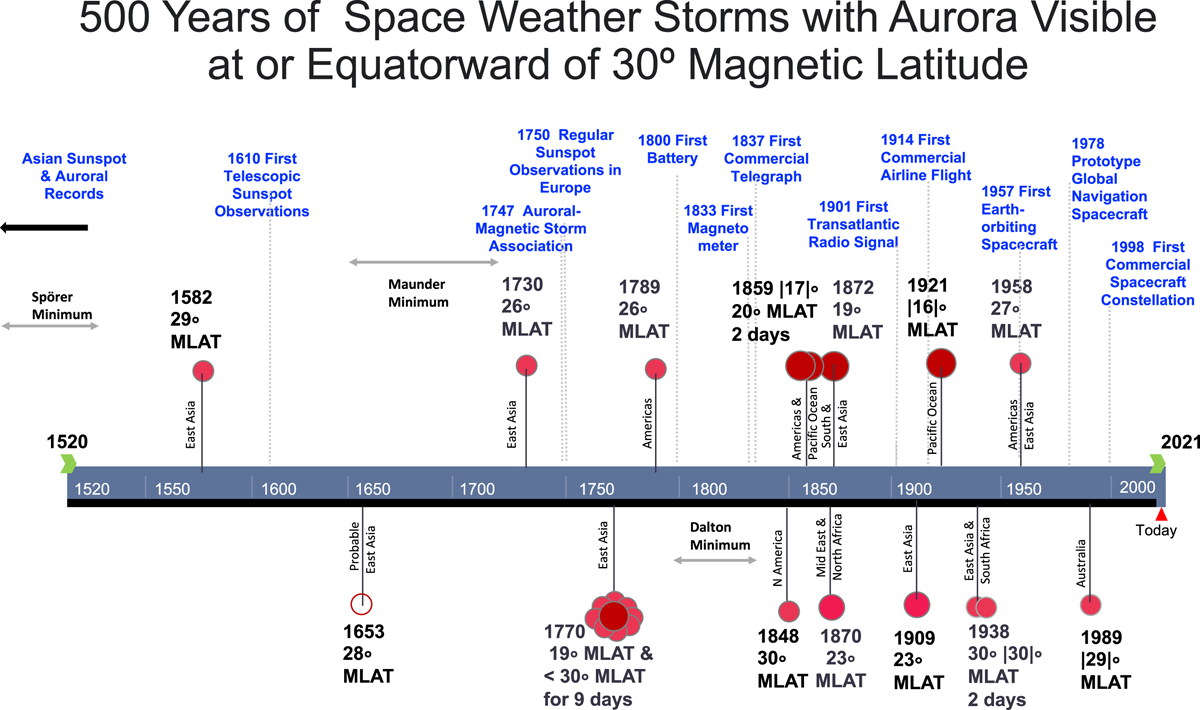
Year and approximate magnetic latitude of lowest latitude report of visible aurora for storms spanning 500 years (1520–2020). The 14 events are placed above and below the timeline to avoid overlap. Brackets indicate southern latitudes. All MLAT values have been rounded to the nearest whole degree. Large circles correspond to more equatorward auroral visibility. An open marker indicates a probable event. See references in Table 1. Several technology developments are listed, as are the approximate intervals of grand/secular solar minima. Credit: D.J. Knapp et al., JSWSC
To demonstrate the effects of space weather storms on society and technology, scientists presented two events.
The first was associated with a series of solar eruptions and geomagnetic storms in January 1938 — a time of increasing reliance on radio technology, but still strong use of telegraph systems.
The storms created awe-inspiring aurora and silenced telegraph and radio communications.
The figure below shows a sequence of three storms in early 1938, with numerous solar flares and probable high-speed ejecta directed at Earth. The ability to recognize and categorize flares was still cutting-edge technology at the time.
More reliance on technology at the time meant more space weather susceptibility.
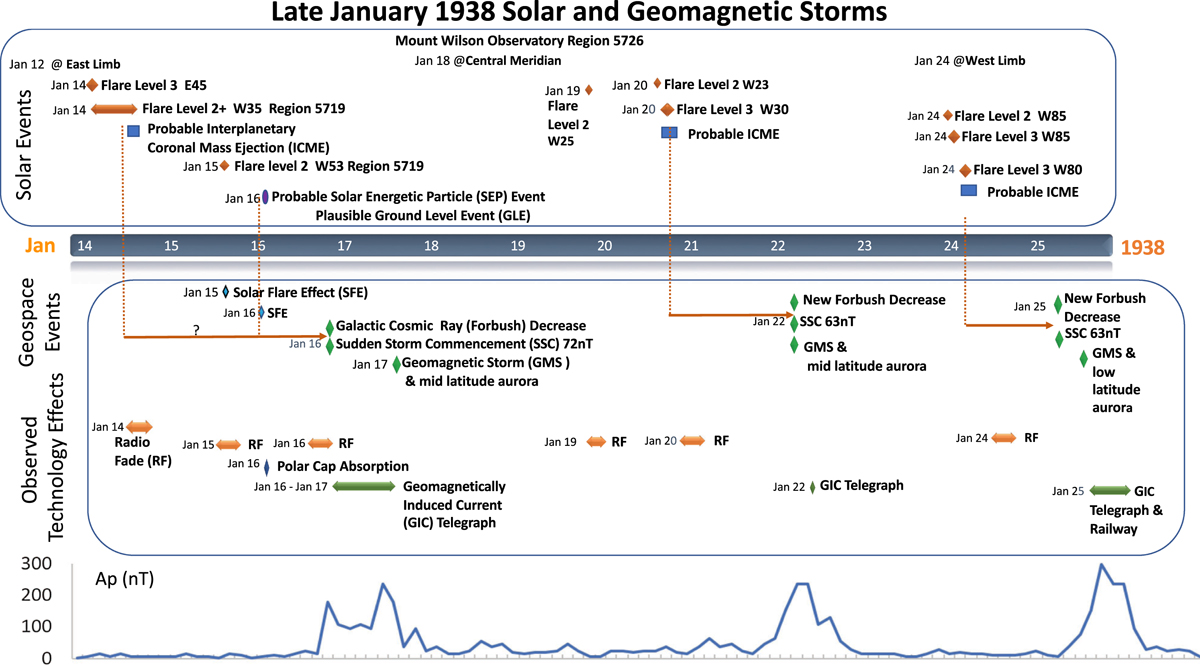
A timeline of solar, geophysical, and technology effects for the January 1938 storms. The two vertical lines for the first storm indicate a range of uncertainty about which solar storms or combinations thereof caused the geomagnetic disturbances on 16/17 January. Events and solar longitudes of flares are from data in Table 2 of Hayakawa et al. (2021a). Credit: D.J. Knapp et al., JSWSC
The 1938 event appears to be the first multi-day storm to have wide effects on commercial aviation documented in newspapers. This event supports the discussion of the typical sequencing and time delays associated with space weather storms. There are a number of basic concepts (and acronyms) for this event that are worthy of attention in a classroom or group discussion setting.
The second event is the strong December 2006 geomagnetic storm that impacted numerous space-based technologies for monitoring space weather and for communication and navigation.
Space systems bore the wrath of that storm, the authors wrote. Space weather X-ray monitors were damaged by intense X-rays, solar energetic particles blinded some imagers, some space plasma measurements for space weather operations were interrupted, while GPS navigation and guidance were interrupted.
In the upheaved thermosphere the International Space Station crew struggled to maintain attitude control while the space shuttle Discovery was docked.
While only minor geomagnetically induced current influences were reported on high-latitude power grids there were significant disturbances in Earth’s ionosphere leading to single-frequency GPS positioning errors. Earth’s radiation belts were enhanced for several weeks.
In addition, instrumentation at other planets also recorded the effects of the storm.
Although the December 14 – 16, 2006 geomagnetic storm did not rate as a severe storm on the DST scale (disturbance storm time), the long list of associated technology challenges suggests that any single storm-scale is likely to fail at adequately describing the possible effects of complex active regions (AR).
These ARs can produce multiple or single fast ejecta and possibly interact with and/or pre-condition geospace to be sensitive to less-than-extreme storm drivers. This event is a candidate for case study and scenario-based exercises.
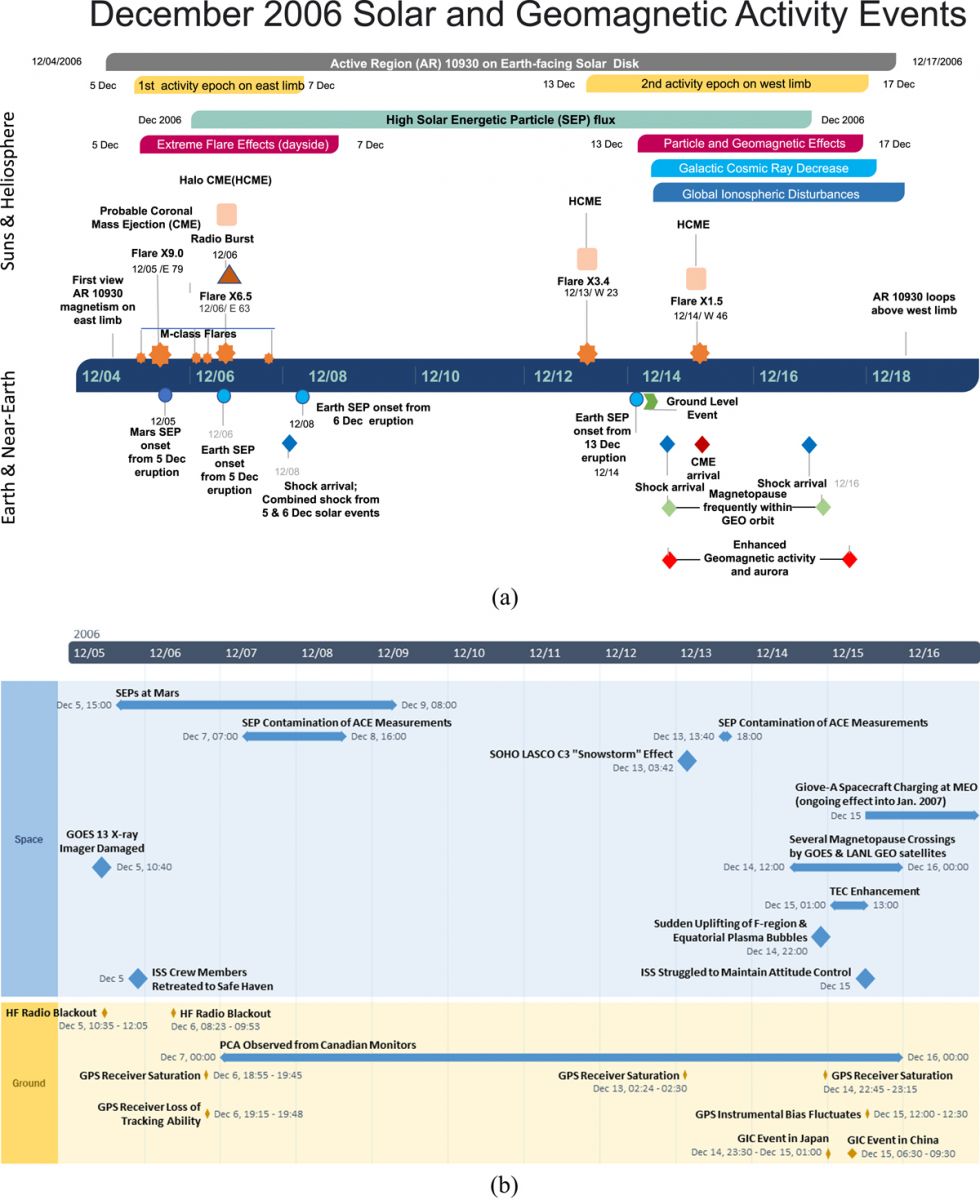
A two-panel timeline of solar, geophysical and technology effects for the December 2006 storms. a) Solar and interplanetary aspects of the event; longitudes of major flares are provided. b) Technology effects and is slightly expanded with respect to panel a. Event start/stop times and thresholds are in the references cited in this section. Credit: D.J. Knapp et al., JSWSC
Several important points were discussed by students involved in this project that the authors deem important for teaching and learning about space weather:
1) There is no comprehensive space weather scale or index that can cover the multitude of space weather responses at Earth.
2) Further, descriptive terms like strong, super, great, or extreme have different meanings within the sub-disciplines in space weather.
3) Sequencing of storm drivers and pre-conditioning of the geospace environment can be difficult to disentangle and produce results very different from what might be anticipated.
4) Despite more than 500 years of great auroral storms, we are only at the beginning of forecasting space weather.
Development of timelines for this article is an outcome of independent study projects using historical literature searches, guided journal-article reading, and archival searches via site visits and the Internet.
Students and novices reported that learning new terminology and cause-and-effect timing in the context of actual events helped solidify their grasp of space weather events.
The authors plan to extend space weather timelines to more interactive platforms, such as web-based interactive formats or toolkits to investigate different scenarios.
While a better understanding of space weather interactions will require a level of visualization not possible with two-dimensional diagrams, such diagrams are a good starting point.
Reference:
Timelines as a tool for learning about space weather storms" – D. J. Knipp et al. – J. Space Weather Space Clim. – DOI: https://doi.org/10.1051/swsc/2021011 – OPEN ACCESS
The Watchers team and our contributors bring the latest on extreme weather, earthquakes, volcanic eruptions, space weather, and all things science. We're all about making sense of the natural world and keeping you informed on what’s happening. Got a tip or a question? Hit us up using the form at newstips!
Commenting rules and guidelines
We value the thoughts and opinions of our readers and welcome healthy discussions on our website. In order to maintain a respectful and positive community, we ask that all commenters follow these rules.