
Tropical cyclone landfall locations over the western North Pacific shifting in 100-year intervals
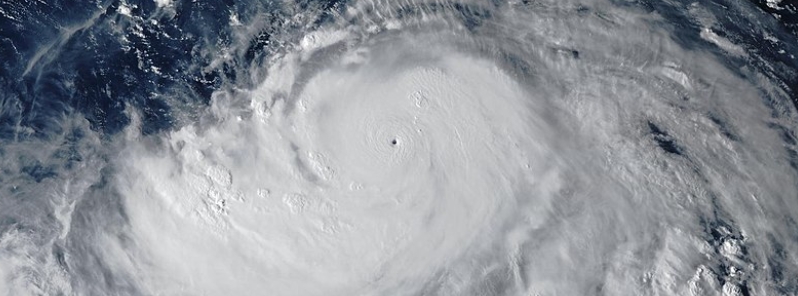
Featured image: 2019 Typhoon Hagibis. Credit: JMA
A team of scientists investigated tropical cyclone (TC) activity over the western North Pacific and landfalls in Japan by examining a combination of TC tracking and meteorological data, including recovered historical observations in the mid-19th century.
- The analysis showed that TC landfall locations tend to shift to the northeast and then southwest regions of Japan at about 100-year intervals.
- The study also showed that yearly TC landfall numbers and their intensities have been increasing in recent years.
In recent years, strong tropical cyclones have been making landfalls in Japan– including the 2018 Typhoon Jebi, which battered the Kinki region, and the 2019 Typhoon Hagibis, which lashed the eastern region. While the country has suffered from a number of storm impacts throughout its history, meteorological data for these events has been limited.
In a new study, a team of researchers investigated the TC activity over the western North Pacific and TC landfalls through a mix of tracking and meteorological data observed at lighthouses and weather stations, including rescued and retrieved historical observations.
The group gathered and recovered TC track, as well as landfall data and meteorological observations in the mid-19th century, and later through an approach that retrieves and digitizes weather data across the world that has been stored away. To give the data consistency, the team formed a new, unified definition for TCs, depending on minimum pressure.
The analysis showed that TC landfall areas tend to shift to the northeast and then southwest regions of Japan at intervals of roughly 100 years.
The study also showed that yearly TC landfall numbers and their intensities have been increasing in recent years, and these increases may be part of an oscillated fluctuation operating on interdecadal time scales.
The landfall numbers were relatively small in the late 20th century, while larger at other times. The study also indicated that the Tohoku and Hokkaido regions, which faced small numbers of TC landfalls in the late 20th century, may see more landfalls in the future.
Japan's first official meteorological observation was in Hakodate, Hokkaido, in 1872. There is very sparse earlier meteorological data acquired by meteorological instruments at terrestrial stations, which makes it challenging for scientists to conduct long-term meteorological variability analyses.
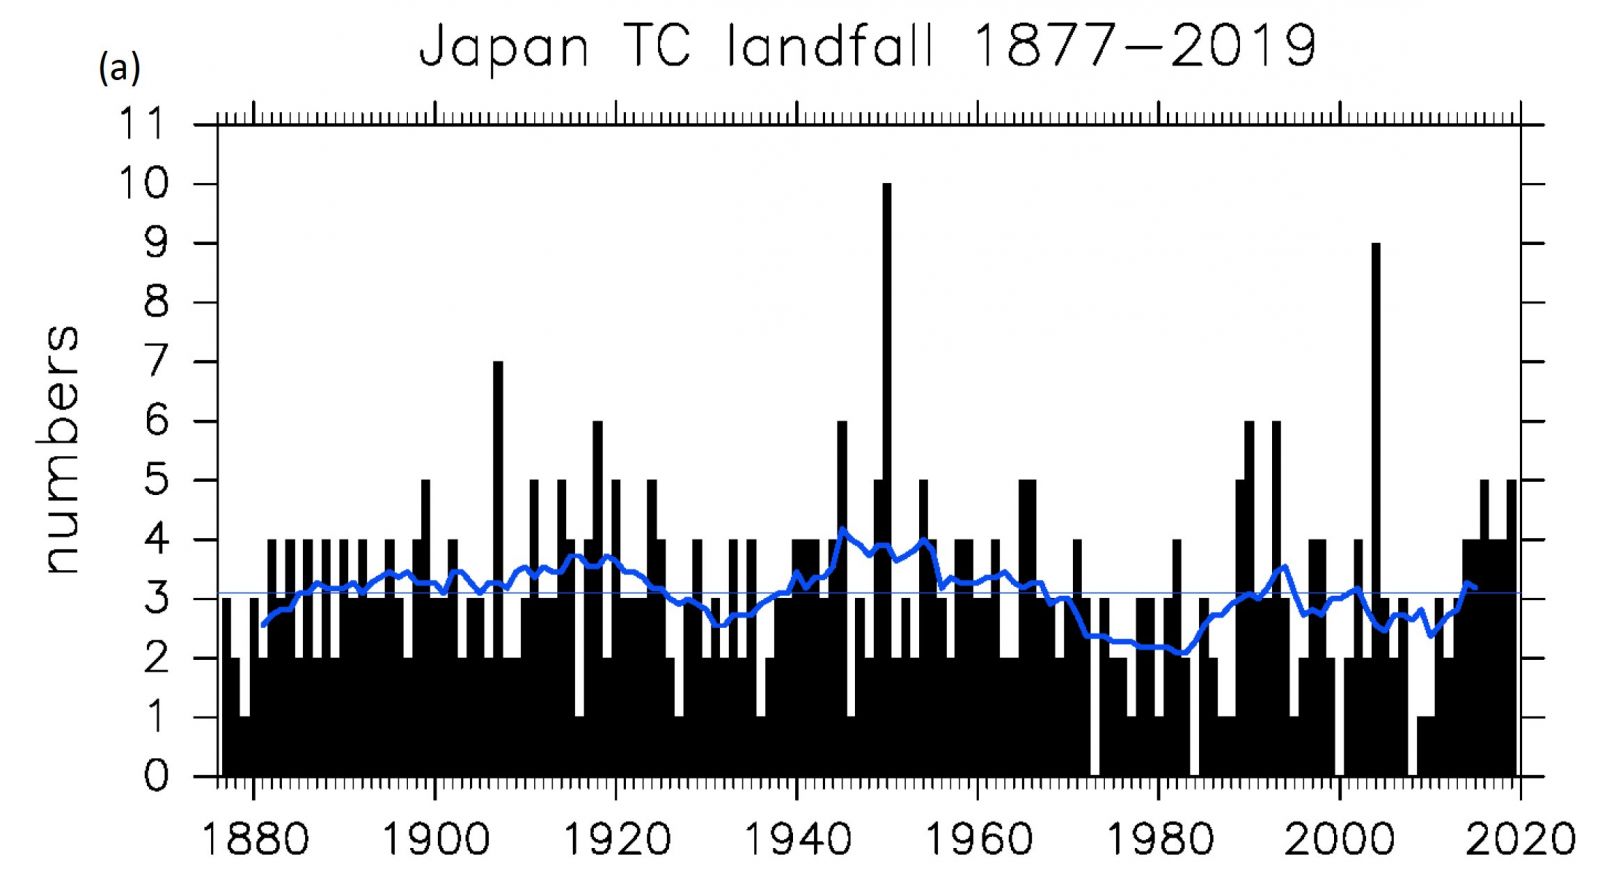
Image: Annual TC landfall numbers in Japan from 1877 to 2019. Credit: Hisayuki Kubota
In the new approach, the team focused on foreign ship log weather records from the mid-19th century made with meteorological tools on vessels sailing through East and Southeast Asian seas.
To precisely identify the TC track over the ocean around the Okinawa Islands from July 21 to 25 in 1853 and the TC track moving north over the East China Sea from August 15 to 16 in 1863, the team used records from the US Navy expedition fleet to Japan and from British Navy ships that also sailed to the country.
For the first time, the results showed the usefulness of such marine data in identifying weather patterns after the mid-19th century in Asia, where there is less meteorological data for that time period, compared to that of Western countries.
"It is projected that stronger TCs will hit Japan in the future due to global warming," said researcher Hisayuki Kubota. "The long-term data from our research is indispensable for knowing the variabilities of TC activities in the past and to prepare for future TCs."
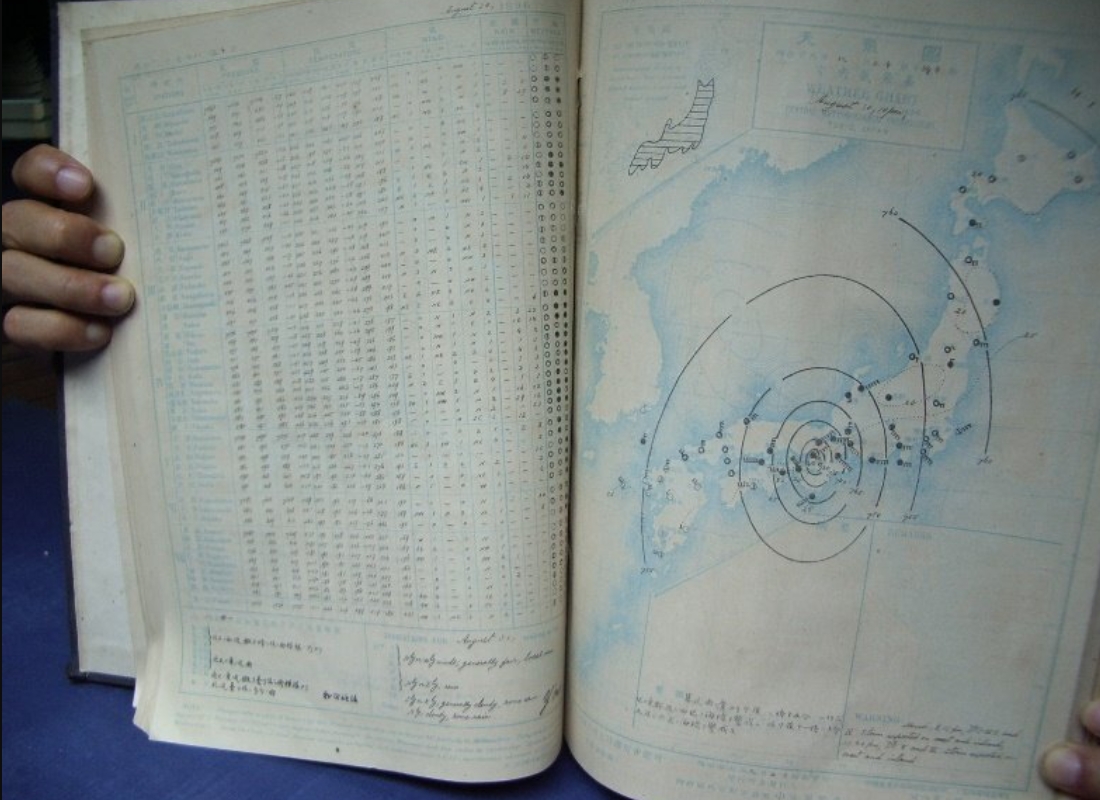
Image: Photo of a weather map when a typhoon hit Japan on 30 August 1896. Credit: Hisayuki Kubota
Reference
"Tropical cyclones over the western North Pacific since the mid-nineteenth century" – Kubota, H., et al. – Climatic Change – DOI: 10.1007/s10584-021-02984-7
Abstract
Tropical cyclone (TC) activities over the western North Pacific (WNP) and TC landfall in Japan are investigated by collecting historical TC track data and meteorological observation data starting from the mid-nineteenth century. Historical TC track data and TC best track data are merged over the WNP from 1884 to 2018. The quality of historical TC data is not sufficient to count the TC numbers over the WNP due to the lack of spatial coverage and different TC criteria before the 1950s. We focus on TC landfall in Japan using a combination of TC track data and meteorological data observed at weather stations and lighthouses from 1877 to 2019. A unified TC definition is applied to obtain equivalent quality during the whole analysis period. We identify lower annual TC landfall numbers during the 1970s to the 2000s and find other periods have more TC landfall numbers including the nineteenth century. No trend in TC landfall number is detected. TC intensity is estimated by an annual power dissipation index (APDI). High APDI periods are found to be around 1900, in the 1910s, from the 1930s to 1960s, and after the 1990s. When we focus on the period from 1977 to 2019, a significant increasing trend of ADPI is seen, and significant northeastward shift of TC landfall location is detected. On the other hand, TC landfall location shifts northeastward and then southwestward in about 100-year interval. European and US ships sailed through East and Southeast Asian waters before the weather station network was established in the late nineteenth century. Then, we focus on TC events in July 1853 observed by the US Naval Japan Expedition of Perry’s fleet and August 1863 by a UK Navy ship that participated in two wars in Japan. A TC moved slowly westward over the East China Sea south of the Okinawa Islands from 21 to 25 July 1853. Another TC was detected in the East China Sea on 15–16 August 1863 during the bombardment of Kagoshima in southern Japan. Pressure data are evaluated by comparing the observations made by 10 naval ships in Yokohama, central Japan during 1863–1864. The deviation of each ship pressure data from the 10 ships mean is about 2.7–2.8 hPa.
Commenting rules and guidelines
We value the thoughts and opinions of our readers and welcome healthy discussions on our website. In order to maintain a respectful and positive community, we ask that all commenters follow these rules.