
Study finds 6 600 spills from fracking in just four US states
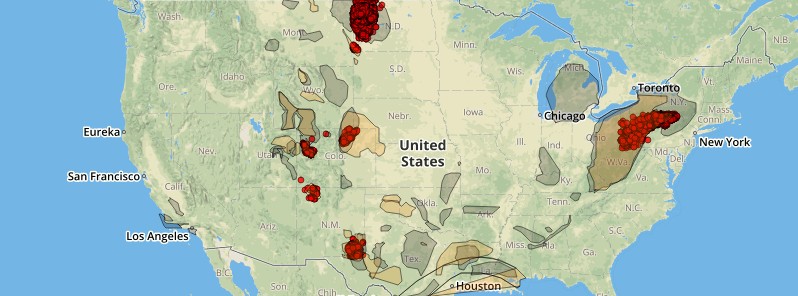
Featured image: Visualizing spills data from unconventional oil and gas activity. Credit: Nicholas Institute/Duke University, SNAPP
Each year, 2 to 16 percent of hydraulically fractured oil and gas wells spill hydrocarbons, chemical-laden water, hydraulic fracturing fluids and other substances, according to a study published yesterday in Environmental Science & Technology.
The analysis, which appeared February 21 in Environmental Science & Technology, identified 6 648 spills reported across Colorado, New Mexico, North Dakota and Pennsylvania during a 10-year period.
“This study provides important insights into the frequency, volume, and cause of spills,” said Lauren Patterson, policy associate at Duke University’s Nicholas Institute for Environmental Policy Solutions and the study’s lead author.
Researchers examined state-level spill data to characterize spills associated with unconventional oil and gas development at 31 481 wells hydraulically fractured or “fracked” in the four states between 2005 and 2014.
“State spill data holds great promise for risk identification and mitigation,” Patterson said. “However, reporting requirements differ across states, requiring considerable effort to make the data usable for analysis.”
North Dakota reported the highest spill rate, with 4 453 incidents, followed by Pennsylvania at 1 293, Colorado at 476 and New Mexico at 426. The number of spills reported is partly a reflection of the reporting requirements set by each state. For example, North Dakota required reporting smaller spills (42 gallons or more) than Colorado and New Mexico (210 gallons or more).
“As this form of energy production increases, state efforts to reduce spill risk could benefit from making data more uniform and accessible to better provide stakeholders with important information on where to target efforts for locating and preventing future spills,” Patterson added.
The results of the study exceed the 457 spills calculated by the U.S. Environmental Protection Agency (EPA) for eight states between 2006 and 2012 because the EPA’s analysis only considered the hydraulic fracturing stage, rather than the full life cycle of unconventional oil and gas production.
“Understanding spills at all stages of well development is important because preparing for hydraulic fracturing requires the transport of more materials to and from well sites and storage of these materials on site,” Patterson said. “Investigating all stages helps to shed further light on the spills that can occur at all types of wells – not just unconventional ones.”
Fifty percent of spills identified in the Environmental Science & Technology article were related to storage and moving fluids via pipelines, although it was not always possible to determine the cause of the spill because some states explicitly required this data to be reported while others relied on narrative descriptions.
Across all states, the first three years of a well’s life, when drilling and hydraulic fracturing occurred and production volumes were highest, had the greatest risk of a spill. The study found that a significant portion of spills (from 26% in Colorado to 53% in North Dakota) occur at wells that experienced more than one spill, which suggests that wells where spills have already occurred merit closer attention.
“Analyses like this one are so important, to define and mitigate risk to water supplies and human health,” said Kate Konschnik, director of the Harvard Law School’s Environmental Policy Initiative. “Writing state reporting rules with these factors in mind is critical, to ensure that the right data are available – and in an accessible format — for industry, states and the research community.”
A data visualization tool of spill data contained in this study is available at http://snappartnership.net/groups/hydraulic-fracturing/webapp/spills.html
DATA: The data, as reported by the states, is all publicly available and accessible. It’s included in the supplemental information in the journal article and accessible at this link: https://knb.ecoinformatics.org/#view/doi:10.5063/F1TB14VK. Materials related to how the data was extracted for each state (http://pubs.acs.org/doi/suppl/10.1021/acs.est.6b05749/suppl_file/es6b05749_si_001.pdf) and a spreadsheet with calculations (http://pubs.acs.org/doi/suppl/10.1021/acs.est.6b05749/suppl_file/es6b05749_si_002.xlsx) is also available online at the same location.
Source: Duke University / Nicholas Institute
Reference:
- "Unconventional Oil and Gas Spills: Risks, Mitigation Priorities and States Reporting Requirements" – L. Patterson, K. Konschnik, H. Wiseman, et. al. – Environmental Science & Technology (2017) – DOI: 10.1021/acs.est.05749.
The Watchers team and our contributors bring the latest on extreme weather, earthquakes, volcanic eruptions, space weather, and all things science. We're all about making sense of the natural world and keeping you informed on what’s happening. Got a tip or a question? Hit us up using the form at newstips!
Commenting rules and guidelines
We value the thoughts and opinions of our readers and welcome healthy discussions on our website. In order to maintain a respectful and positive community, we ask that all commenters follow these rules.