ESA’s Sentinel-1 maps M7.4 Oaxaca earthquake from space, Mexico
ESA's Copernicus Sentinel-1 mission mapped the powerful M7.4 earthquake that struck Mexico's southern state of Oaxaca on June 23, 2020. The satellite radar data are being used to examine the effects of tremors on land.
At around 15:20 UTC (10:20 LT) on June 23, Oaxaca was struck by a very strong and shallow earthquake registered by the USGS as M7.4 at a depth of 26.3 km (14.6 miles), while EMSC reported a depth of 10 km (6.2 miles).
Several powerful aftershocks occurred during the same day, with five more registered in the following 24 hours.
While there is currently no way to forecast when and where quakes will happen, radar imagery from satellites allows experts to observe the effects.
In the figures below, data from Copernicus Sentinel-1A and Sentinel-1B, which were acquired immediately before and after the event, have been gathered to measure the coseismic surface displacement or ground changes that occurred between the two acquisition dates.
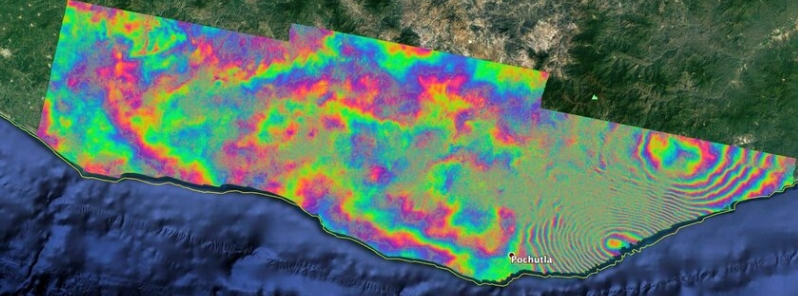
This led to the colorful interference or fringe pattern called an interferogram, which allows scientists to quantify the surface displacement.
"The interferogram represents surface displacement in the radar line of sight, i.e. half of the radar wavelength," Ramon Torres explained, the project manager for Copernicus Sentinel-1.
"The distance between the interference cycle, from yellow to yellow, corresponds to 28 mm (1.1 inch) deformation in the radar line of sight."
Torres added, "for example, a blue-green-red color cycle represents a relative movement towards the radar, while a red-green-blue color cycle means a deformation away from the radar."
"The fringes can be unwrapped to allow the conversion into meters. The result referred to as the surface displacement map shows the relative deformation caused by the earthquake."
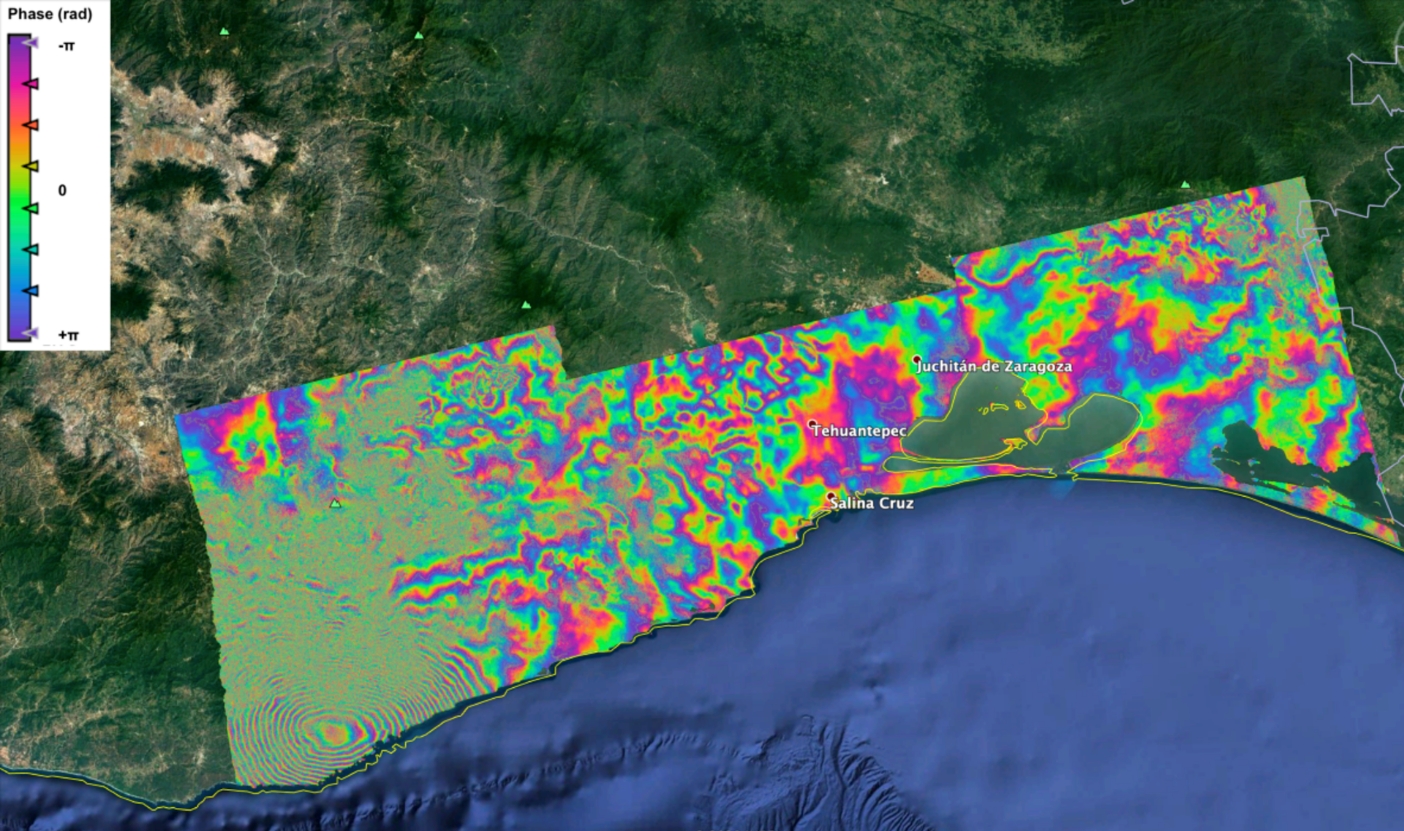
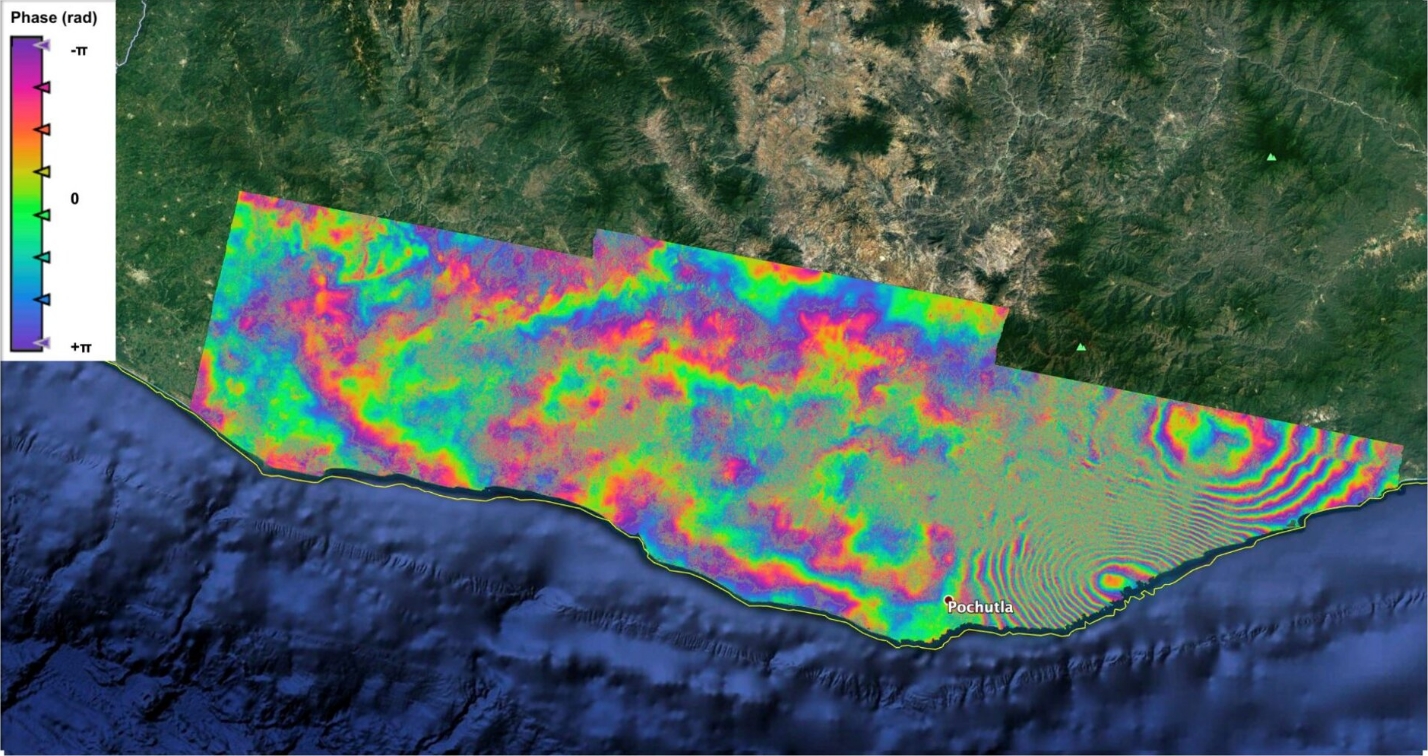
Image credit: ESA Copernicus/Sentinel-1
Ground deformation of up to 450 mm (17.7 inches) was observed in the coastal city of La Crucecita, where the epicenter sits.
The satellite mission gave scientists a wide view of the displacement, allowing them to study the ground displacement and further improve their scientific knowledge of earthquakes.
Imagery from Sentinel-1A and Sentinal-1B enabled scientists to quantify the ground movement in both vertical and east-west directions by merging the radar scans acquired as the satellites flew both south to north and the other way around.
While current radar missions are limited in calculating the east-west component of surface displacement, the proposed Earth Explorer candidate mission Harmony will expand the capabilities by adding further lines of sight to the Sentinel-1 mission.
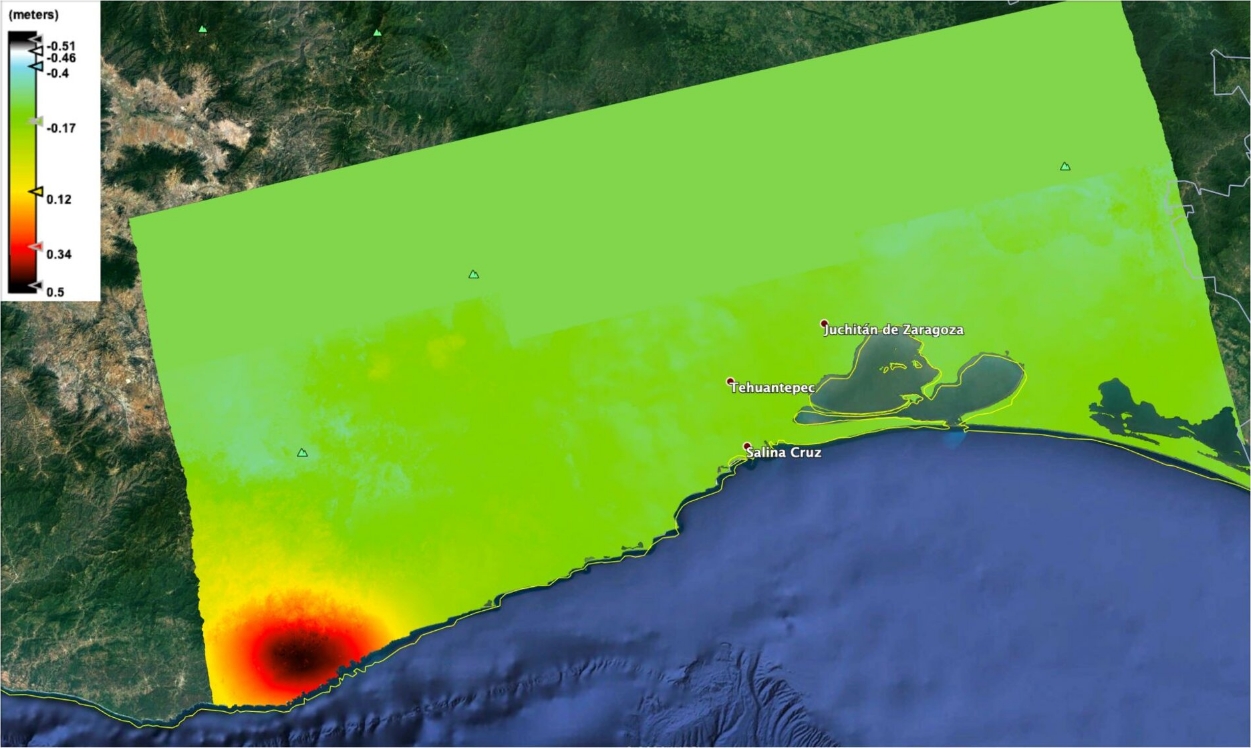
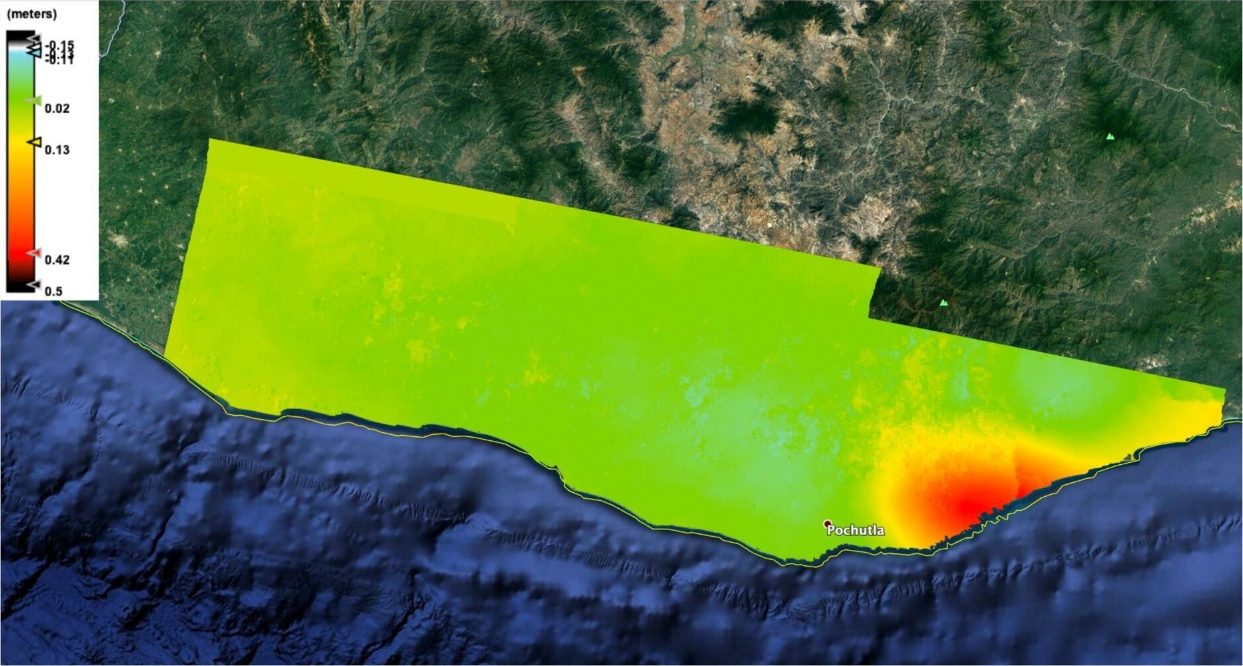
Image credit: ESA Copernicus/Sentinel-1
In areas where the displacement is primarily north-south direction, Harmony will be able to systematically and precisely measure and an additional dimension of displacement, helping to resolve vagueness in the underlying geophysical processes that led to seismic events.
Six upcoming high-priority candidate missions will augment the current capacity of the Sentinel missions, one of them being the L-band Synthetic Aperture Radar, ROSE-L.
"The Sentinel-1 services are very well guaranteed for decades to come," Torres said.
"The upcoming Sentinel-1C and Sentinel-1D are in the process of being completed, and the design of the next generation of satellites will begin later this year."
Featured image credit: ESA Copernicus/Sentinel-1
Great article, but, THERE ALREADY EXISTS A PROVEN METHOD TO FORECAST EARTHQUAKES. Dutchsinse (Michael Janitch), on Twitch and YouTube, has been doing it for years. What follows are my words and my opinion. I do not speak for Mr. Janitch nor does he know I’m making this comment. Now, in summary, here’s what HE’s discovered: 1) You can forecast earthquakes to a 70-80 percent degree of accuracy, or higher, and on a continual basis, by understanding that seismic energy travels the globe via very specific and set paths ALONG PLATE BOUNDARIES. See his “Seismic Pressure Transfer Map” that shows the very specific path and direction of seismic pressure that is superimposed on a 3D globe. 2A) Very deep earthquakes, approximately 200 kilometers/125 miles and deeper, cause larger shallower quakes (by one magnitude or more) above where the deep quake occurred. 2B) There are multiple but very well defined locations where deep earthquakes originate. 3) As seismic pressure and earthquakes travel around the globe, “silent zones” develop between where two, similar sized quakes have occurred — a third quake frequently occurs at the middle, or “fulcrum” point between the two locations, even when the two original quakes are a great distance apart. 4) Solar storms that impact earth provide a substantial amount of new energy and initiate new, deep quakes to begin another cycle as that energy spreads across the globe. The primary “origination zone” is in the south pacific. There are also “termination zones” where pressure stops. In summary, in my view the world owes a debt of gratitude to Mr. Janitch. He was the first one, likely in history, to see the forest when every scientist and every one else is still standing in the trees. If you have any doubts, spend 10 or 20-minutes watching one of his videos. He leads you out of the trees, your eyes will open to how he figured it out, and you’ll be hooked on watching his regular forecasts.