Drilling into magma reservoirs to improve volcano forecasts
The roots of volcanoes remain enigmatic, largely because geophysical and petrological models remain rudimentary. Scientific drilling and exploration can help.
When it comes to forecasting eruptions, volcano observatories rely mostly on real-time signals from earthquakes, ground deformation, and gas discharge, combined with probabilistic assessments based on past behavior [Sparks and Cashman, 2017]. There is comparatively less reliance on the geophysical and petrological understanding of subsurface magma reservoirs.
So although each year brings exciting advances to the study of magma reservoirs, the link between this research and hazard forecasting, at the moment, is a bit tenuous. Conceptual models of magma reservoirs provide some constraints on hazards but remain highly approximate, as do our ideas about the dynamics of magma mobilization and eruption [Wilson, 2017].
How can we change that? Future improvements in visualizing the subsurface, interpreting signals resulting from magmatic activity, and forecasting eruptions all will require more in situ data and subsurface exploration by scientific drilling into the very hot, pressurized environment surrounding magmas.
Here, using the Yellowstone plateau as an example, we review current understanding of magma storage regions as relevant to volcanic hazards. We focus on two popular techniques for characterizing magma reservoirs, one geophysical (seismic tomography) and the other petrological (geospeedometry). We then suggest a third option—scientific drilling—that has the potential to dramatically improve our understanding of magma dynamics.
Magma is a high-temperature mixture of silicate melt, crystals, and bubbles. The relative proportions of these constituents can vary widely, with important implications for eruption potential. Key questions remain. (1) Is magma in the reservoir eruptible, containing more than ~50% melt [Marsh, 1981]? (2) If not, how quickly might the system be transformed from a stagnant, crystal-rich body to an eruptible magma? (3) What ultimately triggers the magma to erupt? These questions are common targets of present-day geophysical and petrological research.
How much melt? Issues with imaging the magma
Geophysical techniques such as gravity and electromagnetics have been used to estimate the crystallization state of magmatic intrusions. Most common, however, are tomographic images derived by inversion of travel times from regional or global earthquakes or even from ambient noise.
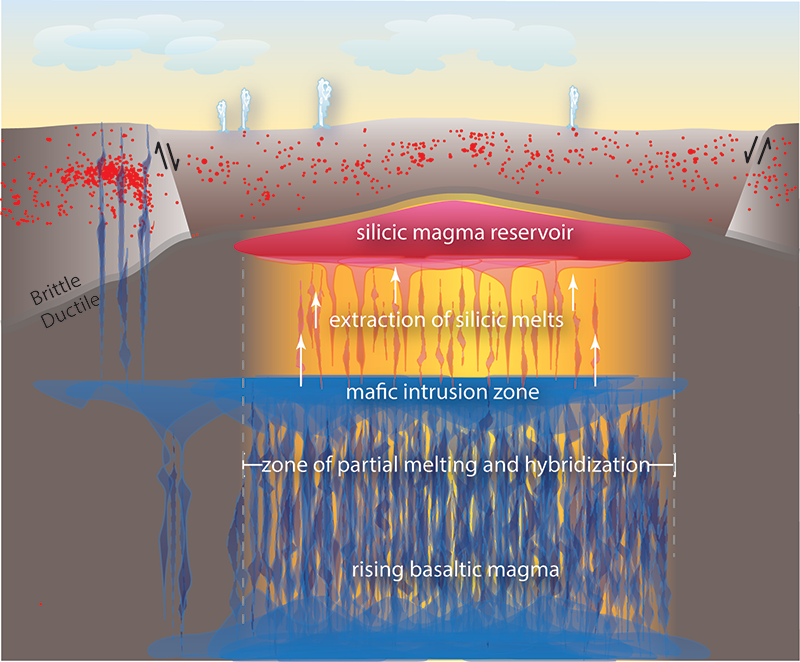
Schematic diagram of the magmatic system beneath Yellowstone caldera (~50 kilometers or 31 miles in diameter). Tomographic studies estimate 5% to 15% melt within the upper silicic magma reservoir. Red dots are earthquake hypocenters. Credit: Modified from Lowenstern and Hurwitz [2008]
In our case study of Yellowstone, results from recent seismic tomography studies suggest melt percentages of 5% to 15% integrated across the upper crustal magma reservoir that underlies the Yellowstone caldera [Farrell et al., 2014]. Because magma almost never erupts with less than around 50% melt [Marsh, 1981], at first blush it seems unlikely that another eruption could be in the offing.
However, tomography yields an averaged view of the seismic velocity structure in the section of the solid Earth being imaged. It relies on broad seismic wavelengths of hundreds of meters to hundreds of kilometers, thereby limiting the best-case resolution. Even with dense seismometer networks, it is challenging to discern upper crustal anomalies smaller than ~5 cubic kilometers (1.2 cubic miles). And the Yellowstone plateau’s network isn’t this dense—the plateau is very large, so its 40 or so seismic stations are typically spaced at distances of 5 to 20 kilometers (3 to 12 miles), thus rarely allowing us to resolve features much smaller than 10 kilometers (6.2 miles) across.
Plus, there are other issues to consider when using tomography. There is no guarantee that the first-arriving waves recorded through the technique transited directly through the magma; they could, instead, have transited more quickly through adjacent colder rocks, thus missing the most-liquid-rich (slower) regions.
And then there is the complicated issue of translating the modeled velocity delay into an actual melt fraction. The relevant references are analogue lab experiments and theoretical models, but they may not adequately apply to crustal magma bodies. Then add in assumptions on the values assigned for key variables on rock physical properties such as shear modulus and compressibility, which can change with the addition of bubbles, crystals, and directionally dependent factors involving rock texture (i.e., textural anisotropy).
Although the existing tomographic image of Yellowstone is clearly first rate, all of the above confounding factors point to one conclusion: It’s still possible that our estimates of melt fractions are inaccurate. No matter how you slice it, there is abundant wiggle room in our best guess at the state of the magma reservoir.
Thus, we have to proceed with caution and accept that our subsurface images remain rudimentary.
Where the melt is
The overall uncertainty affects our assessment of global volcanism. Technological constraints mean that some magma bodies will not be found. Others that we have found will turn out to be fictive.
Eruptible magmas also can hide within an average 85%–95% crystal mush. Back at Yellowstone, Farrell et al. [2014] conservatively estimated that 200 to 600 cubic kilometers (48 to 144 cubic miles) of melt are distributed within a larger crystal mush underlying the plateau. It could be homogeneously distributed, and thus uneruptible, but there are many other options for distribution of melt-rich dikes, sills, or stocks that would yield the average 10% by volume melt fraction observed at Yellowstone.
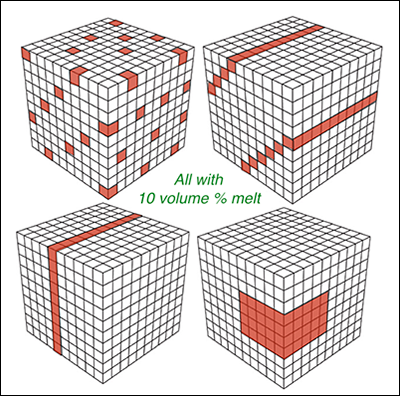
If tomography indicates an averaged 10% magma by volume, it could mean any number of scenarios. The top left schematic shows a more dispersed distribution; in this scenario, an eruption is unlikely. However, the remaining images show dikes (top right and bottom left) and a melt-rich reservoir (bottom right). In these three other scenarios, magma could more readily erupt. Credit: Jacob Lowenstern
For example, it seems reasonable to expect that a 5 × 5 × 1 km (3.1 x 3.1 x 0.62 miles) sill of eruptible magma could reside within the resolution of the existing tomography. That 25 cubic kilometers (6 cubic miles) could produce an explosive eruption larger than any worldwide in the past 200 years.
And what’s true for Yellowstone has implications for volcanoes worldwide. The bottom line is images of crustal magma reservoirs are blurry, uncertainties remain large, and significant volumes of eruptible magma may hide within the imaged crystal-rich reservoirs beneath volcanoes.
Clues in the crystals
Other evidence for the nature of magma reservoirs is gathered from clues hidden in erupted crystals. The depths and temperatures of magma storage are inferred through what are known as geobarometers and geothermometers. One popular geobarometer is based on the concentrations of volatiles (water, carbon dioxide, sulfur, chlorine, fluorine) dissolved within melt inclusions trapped in erupted crystals: Solubilities scale with pressure, so that higher concentrations imply deeper depths. An experimentally derived geobarometer is based on the aluminum concentration in the mineral hornblende.
Magma temperatures are revealed through the iron and titanium exchange in oxide minerals or similar exchange reactions in feldspars and pyroxenes. Temperatures can also be deduced from the concentrations of titanium in zircon and quartz, an element that increasingly substitutes for silicon and zirconium as temperature rises.
Recently, petrologists have become much better at exploring another key variable: time. Erupted pumices and crystal clots can testify to the processes underway in the subsurface magmatic system.
For example, scientists are exploring how fast silicate melts can be expelled from mostly stagnant crystal mushes. Some recent petrological studies suggest that this process could take as little as a few weeks. They focus on diffusion profiles of trace elements in erupted phenocrysts [Costa et al., 2003].
The concept here is that crystals in the magma reservoir have a late growth episode that creates a sharp compositional gradient. In most cases, the ubiquity of similar rims on similar crystals shows that the crystal growth episode was system wide and therefore reveals a widespread phenomenon, often indicative of a new injection of hot magma that mixes into and disturbs the host magma reservoir.
Over time, any steep compositional gradient in crystal rims would smear out by diffusion at magmatic temperatures. But if the gradient remains sharp, theoretically, that means that the crystal could not have remained hot for very long prior to its eruption.
Using this technique, a study specific to Yellowstone posits that the rhyolite that erupted 250 000 years ago to form the Scaup Lake lava flow was rapidly extracted from a crystalline mush that previously lay dormant for 220 000 years. How fast was this extraction? A mere 10 months, the researchers estimate. This quick mobilization was calculated using the time beyond which sharp gradients in trace element concentrations observed in crystal rims would have smoothed out [Till et al., 2015].
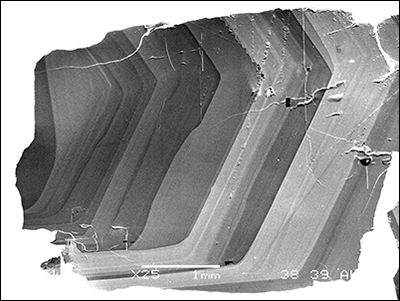
Photomicrograph of sanidine from California’s Inyo Domes illustrating sharp growth zones. These zones track different episodes in the evolution of the magma surrounding these crystals as they grew. Credit: N. Matthews and J. Vazquez, USGS
But it is important to recognize some uncertainties in these geospeedometers. The crystal rims may have formed within months of the eruption, but how much time elapsed after the system was reawoken and before the last crystal layer was actually precipitated? If the system was heating up to allow loosening of the mush and migration of melt and old crystals, why were the crystals growing, which might be expected to happen instead during cooling? Could that last crystallization episode be years, decades, centuries, or even millennia after the initial perturbation that eventually liberated the future eruptive unit from stagnant mush?
After examining oxygen isotope zoning in coerupted zircons, Till et al. [2015] report that this total time period may have lasted up to ~1 200 years. Additional sizable uncertainties remain regarding our experimental calibration of the relevant diffusion coefficients of the trace elements as well as the temperatures at which the elements diffused.
Tying crystals to forecasts
It can be hard to know how these crystal-focused studies, although informative, could directly improve forecasting, as is sometimes implied. Clearly, there is evidence for magma mixing in the crystal stratigraphy, but such evidence commonly exists also in interior parts of the crystals, as well as on their rims, indicating that magma recharge does not always trigger a volcanic eruption.
Admittedly, compared with the infrequent eruptions at Yellowstone, many active volcanoes appear to be spurred toward eruptions by deep intrusion of mafic magma [Sparks et al., 1977]. In such systems, we can more readily link crystal stratigraphies to episodes of recent preeruptive unrest, even if we have to wait until the eruption is over to collect the evidence.
Ultimately, such studies will allow us to make progress in understanding how geophysical monitoring ties to magma movement, crystallization, and degassing. Yet even if we can document a mechanism and detailed history for a given eruption, other mechanisms might be more relevant 10 years later or 100 km (62 miles) away at a different volcano.
Drilling into magma
All of this points to one inescapable fact. We rarely measure the key variables operative in the magmatic environment. Despite major advances in geophysics and petrology, more in situ data on subsurface magmas and their surrounding hydrothermal shells are required.
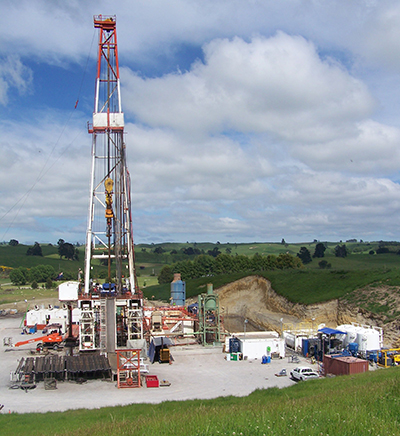
Geothermal drill rig at Te Mihi, New Zealand. To learn more about magma reservoirs, geothermal drill holes could be extended, with scientific drilling aimed at probing magmatic environments. Credit: R.G.J. Lewis, CC BY-SA 3.0
We see an underexplored route to get these data: drill upper crustal magma reservoirs and their peripheries. After drilling, the holes could be used as instrumented observatories.
Among many other possibilities, such data could tell us if the spectacular inflations and deflations of calderas appear as commensurate and synchronous changes in the temperature, pressure, and flow rates of hydrothermal fluids. Or we might track changes during intrusive episodes by observing real-time seismic velocity changes in the materials in between two drill holes (using one as a source and the other as a receiver).
Drilling studies are expensive, technically challenging, and time-consuming. They require cooling the rock in front of the drill bit to quench a narrow cylinder of melt so that it can be further penetrated.
But ultimately, we need to collect and analyze such samples if we want to confirm conceptual models. And we need to collect more data on elusive intensive variables, fluid compositions, and rock properties near and within the magma to model complex monitoring data [Anderson and Segall, 2011; Gregg et al., 2013]. Otherwise, we are basing sophisticated numerical models on rough guesstimates of the relevant controlling variables. Once drilled, boreholes serve as the best observatories we can develop, with a far superior signal to noise ratio of geophysical data than is available at the surface.
Past drilling campaigns
Past drilling programs near intrusions have yielded critical insights. The work at Kakkonda in Japan revealed the steep permeability and lithological gradients where magmatic and hydrothermal regimes interact at the brittle-ductile transition [Saito et al., 1998].
The Iceland Deep Drilling Program’s well at the island’s Krafla caldera intercepted rhyolite melt in the region where geophysics had implied it would be absent [Elders et al., 2011]. The very high permeability of the region around the intrusion seems in direct conflict with the lessons from Kakkonda, challenging our existing notions of how temperature, pressure, and permeability should relate.
In the Long Valley Exploratory Well in eastern California an unexpectedly cool maximum temperature of about 100 °C (212 °F) was measured where the presence of shallow magma or at least very hot rock was expected prior to drilling [Sorey et al., 2003].
Perhaps some of the best samples of an actual solidifying magma reservoir were provided by the U.S. Geological Survey (USGS) drilling into the 1959 lava lake at Kīlauea Iki, Hawaii. The core collected showed temporal change in temperature, growth of crystals, loss of bubbles, settling of olivine phenocrysts, and migration of late-stage liquids as diapirs and into sills, coupled with observations of seismic velocity and electrical conductivity that could be interpreted in light of direct samples [Helz, 1987].
Because we have drilled into relatively few volcanic settings, each new opportunity provides tremendous surprises and new insights.
The case for drilling
Many geoscience fields have had great success in incorporating scientific drilling into their baseline data collection. The United States alone has spent more than a billion dollars of public money on ocean drilling [Winterer, 2000]. Private industry has spent many, many billions of dollars drilling into sedimentary basins, and the result has been continuous refinement of techniques that allow us to reliably interpret a whole suite of geophysical methods (e.g., seismic refraction and reflection).
Unfortunately, the well-studied sedimentary basins and oceanic spreading centers are poor analogues for active continental magmatic systems, which are much more heterogeneous with respect to temperature, pressure, and material properties.
As a result, crustal magma reservoirs remain poorly characterized. We lack the “underground truth” obtained by the detailed drilling programs undertaken in sedimentary basins. But combined geophysical imaging and targeted drilling could greatly improve our images of the volcano subsurface.
Although drilling is seldom allowed in designated wilderness such as Yellowstone, there are numerous other locations worldwide where suitable volcanic systems can be explored. Safety concerns are magnified in hydrothermal environments, but they can be overcome with adequate planning and prudence.
Volcanic eruptions are some of the most destructive events facing humankind. To prepare for these events, the science of eruption forecasting needs advancement. As we penetrate and monitor the volcano-hydrothermal interface, we will inevitably advance tomographic methods, petrologic insights, and our ability to integrate monitoring data into more robust and reliable eruption forecasts.
References
Anderson, K., and P. Segall (2011), Physics‐based models of ground deformation and extrusion rate at effusively erupting volcanoes, J. Geophys. Res., 116, B07204, https://doi.org/10.1029/2010JB007939.
Costa, F., S. Chakraborty, and R. Dohmen (2003), Diffusion coupling between trace and major elements and a model for calculation of magma residence times using plagioclase, Geochim. Cosmochim. Acta, 67(12), 2189–2200, https://doi.org/10.1016/S0016-7037(02)01345-5.
Elders, W. A., et al. (2011), Origin of a rhyolite that intruded a geothermal well while drilling in a basaltic volcano, at Krafla, Iceland, Geology 39, 231–234, https://doi.org/10.1130/G31393.1.
Farrell, J., et al. (2014), Tomography from 26 years of seismicity revealing that the spatial extent of the Yellowstone crustal magma reservoir extends well beyond the Yellowstone caldera, Geophys. Res. Lett., 41, 3068–3073, https://doi.org/10.1002/2014GL059588.
Gregg, P. M., S. L. de Silva, and E. B. Grosfils (2013), Thermomechanics of shallow magma chamber pressurization: Implications for the assessment of ground deformation data at active volcanoes, Earth Planet. Sci. Lett., 384, 100–108, https://doi.org/10.1016/j.epsl.2013.09.040.
Helz, R. T. (1987), Differentiation behavior of the Kilauea Iki lava lake, Kilauea volcano, Hawaii: An overview of past, present, and future work, in Magmatic Processes: Physicochemical Principles, edited by B. O. Mysen, Spec. Publ. Geochem. Soc., 1, 241–258.
Lowenstern, J. B., and S. Hurwitz (2008), Monitoring a supervolcano in repose: Heat and volatile flux at the Yellowstone caldera, Elements, 4, 35–40, https://doi.org/10.2113/GSELEMENTS.4.1.35.
Marsh, B. D. (1981), On the crystallinity, probability of occurrence, and rheology of lava and magma, Contrib. Mineral. Petrol., 78, 85–98, https://doi.org/10.1007/BF00371146.
Saito, S., S. Kakuma, and T. Uchida (1998), Drilling procedures, techniques and test results for a 3.7 km deep 500°C exploration well, Kokkonda, Japan, Geothermics, 27(5–6), 573–590, https://doi.org/10.1016/S0375-6505(98)00034-0.
Sorey, M. L., V. S. McConnell, and E. Roelloffs (2003), Summary of recent research in Long Valley Caldera, California, J. Volcanol. Geotherm. Res., 127, 165–173, https://doi.org/10.1016/S0377-0273(03)00168-9.
Sparks, R. S. J., and K. V. Cashman (2017), Dynamic magma systems: Implications for forecasting volcanic activity, Elements, 13, 35–40, https://doi.org/10.2113/gselements.13.1.35.
Sparks, R. S. J., H. Sigurdsson, and L. Wilson (1977), Magma mixing: A mechanism for triggering acid explosive eruptions, Nature, 267, 315–318, https://doi.org/10.1038/267315a0.
Till, C., J. A. Vazquez, and J. W. Boyce (2015), Months between rejuvenation and volcanic eruption at Yellowstone caldera, Wyoming, Geology, 43, 695–698, https://doi.org/10.1130/G36862.
Wilson, C. J. N. (2017), Volcanoes: Characteristics, tipping points, and those pesky unknown unknowns, Elements, 13, 41–46, https://doi.org/10.2113/gselements.13.1.41.
Winterer, E. L. (2000), Scientific ocean drilling, from AMSOC to COMPOST, in 50 Years of Ocean Discovery: National Science Foundation 1950–2000, pp. 117–127, Natl. Acad. Press, Washington, D. C.
Provided by EOS
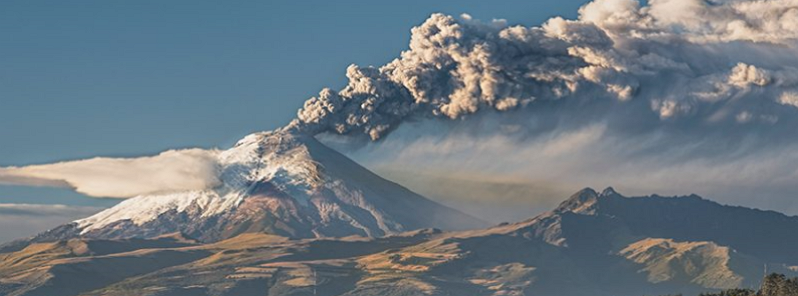
Featured image: A view of Ecuador’s Mejía Canton in 2015, with Cotopaxi volcano erupting in the background. To help people who live on or near volcanoes, scientists tasked with improving forecasts of volcanic eruptions seek more detailed understanding of subsurface magma reservoirs. Credit: Henri Leduc/Moment/Getty Images Plus
Commenting rules and guidelines
We value the thoughts and opinions of our readers and welcome healthy discussions on our website. In order to maintain a respectful and positive community, we ask that all commenters follow these rules.