Drastic increase in the number of icebergs in transatlantic shipping lanes
Last week, we reported car and house-sized chunks of broken-up sea ice are being pounded onto the shore of St. John's harbor in a sight locals haven't seen since the 1980's. Now, USCG's International Ice Patrol reports a drastic increase in icebergs drifting in the transatlantic ship lanes.
As of April 4, 2017, 455 icebergs have drifted or been sighted south of 48°N in the transatlantic shipping lanes, according to the U.S. Coast Guard's International Ice Patrol. On average, 83 icebergs drift south of this latitude by the end of March based on data collected between 1900 and 2016. The number of icebergs we are seeing now is usually not seen until late May or early June.
Coast Guard Cmdr. Gabrielle McGrath, who leads the ice patrol, told AP she has never seen such a drastic increase in such a short time. Adding to the danger, three icebergs were discovered outside the boundaries of the area the Coast Guard had advised mariners to avoid, she said. According to AP, McGrath is predicting a fourth consecutive "extreme ice season" with more than 600 icebergs in the shipping lanes.
"Cold temperatures and persistent, strong northerly winds caused sea-ice expansion south and east through to near 46°N," IIP said in their 7-day Iceberg Outlook released April 5. "These conditions also brought significant numbers of icebergs into Flemish Pass. During the last week of March, three icebergs were detected outside of IIP’s published Iceberg Limit."
"While sea ice is forecasted to contract and recede to the north, hundreds of icebergs are expected to continue drifting the Flemish Pass expanding the Iceberg Limit southward. The Southern Iceberg Limit will reach near 42°N close to the mid-April median Iceberg Limit while the Eastern Iceberg Limit is expected to remain inside of the mid-April median over the next seven days," IIP said.
IIP’s data records, which extend to 1900, show that nearly 500 icebergs enter the shipping lanes in an average year. However, the year-to-year variation is wide. In 1984, the busiest iceberg year in IIP’s history, 2 202 icebergs entered the shipping lanes. On the other hand, during two years (1966 and 2006) no icebergs reached the shipping lanes.
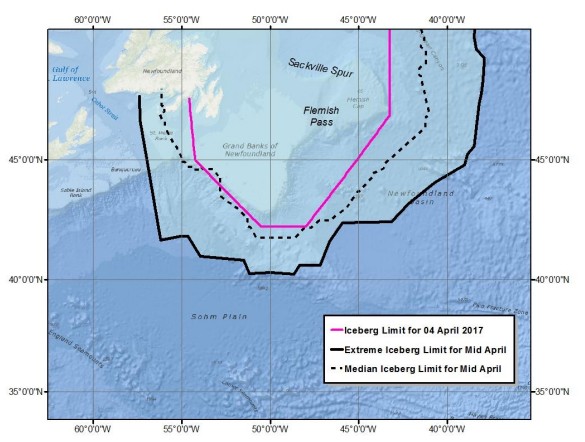
Credit: U.S. Coast Guard's International Ice Patrol (IIP)
Credit: U.S. Coast Guard's International Ice Patrol
Last Thursday, March 30, 2017, Weather Network reporters Mark Robinson and Chris St. Clair were at a beach on the Avalon Peninsula in Canada and found a car and house-sized chunks of broken-up sea ice were being pounded onto the shore.
The ice continued to enter the St. John's harbor on the following day, they said and added that these chunks are huge but compared to what's out at sea are 'really quite small.'
Video courtesy The Weather Network
The icebergs are forcing vessels to slow to a crawl or take detours of hundreds of miles, AP reported.
In the waters close to where the Titanic went down in 1912, the icebergs are forcing ships to take precautions, it said. Instead of cutting straight across the ocean, trans-Atlantic vessels are taking detours that can add around 650 km (400 miles) to the trip.
Video courtesy The Weather Network
Icebergs in Newfoundland
According to the USGS Navigation Center, icebergs are found in many parts of the world’s oceans, but perhaps the best-known location is the western North Atlantic Ocean, which is where the RMS Titanic struck an iceberg and sank in 1912. This is the only place where a large iceberg population intersects major transoceanic shipping lanes.
Most of the icebergs that enter the North Atlantic shipping lanes come from the tidewater glaciers of the west coast of Greenland. Once an iceberg is calved from one of these glaciers it completes a 1-3 year journey to arrive in the area that the International Ice Patrol (IIP) monitors.
IIP’s data records, which extend to 1900, show that nearly 500 icebergs enter the shipping lanes in an average year. [The 1900-2010 average is 479.] However, the year-to-year variation is wide. In 1984, the busiest iceberg year in IIP’s history, 2202 icebergs entered the shipping lanes. On the other hand, during two years (1966 and 2006) no icebergs reached the shipping lanes.
Researchers have struggled for many decades trying to explain the year-to-year variation in the number of icebergs entering the North Atlantic shipping lanes. It is likely that fluctuation in the number of icebergs produced by the Greenland glaciers plays a role in the variability, but it might not be the dominant factor. The oceanographic and meteorological conditions icebergs encounter during their one to three year journey from the glacier’s calving front to the shipping lanes probably play larger roles.
There seems to be a link between IIP’s iceberg counts and the North Atlantic Oscillation (NAO), the dominant pattern of winter atmospheric variability in the North Atlantic. It fluctuates between negative and positive phases. Conditions associated with the negative phase of the NAO are unfavorable to the movement of icebergs toward the shipping lanes. The characteristic features of this phase include persistent onshore winds along the Labrador coast during the winter. This brings relatively warm maritime air to Labrador. The resulting lack of sea ice exposes icebergs to wave-induced deterioration, and the onshore wind moves them toward the shallower waters near the coast, where they can run aground or become trapped in bays. The positive NAO phase, on the other hand, is characterized by strong and persistent northwest winds along the Labrador coast during the winter. These winds bring cold air and extensive sea ice cover, which protects the icebergs during the last part of their journey south, a journey aided by the long-shore wind.
The inter-annual variability in the western North Atlantic iceberg counts remains impressive and difficult to understand and predict. Although the NAO index offers some help, it is clear that there are other mechanisms at work. (USCG Navigation Center)
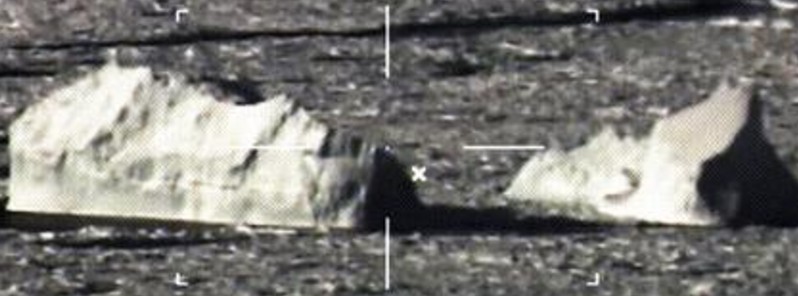
Featured image: Photo shows icebergs floating near the Grand Banks of Newfoundland. Credit: U.S. Coast Guard
Commenting rules and guidelines
We value the thoughts and opinions of our readers and welcome healthy discussions on our website. In order to maintain a respectful and positive community, we ask that all commenters follow these rules:
We reserve the right to remove any comments that violate these rules. By commenting on our website, you agree to abide by these guidelines. Thank you for helping to create a positive and welcoming environment for all.