Ventura fault can cause stronger shaking and more damage
A new study suggests that the fault under Ventura, California would cause stronger shaking during an earthquake and more damage that previously suspected.
The Ventura Fault, also known as Ventura-Pitas Point fault, in southern California has been the focus of a lot of recent attention because it is thought to be capable of magnitude 8 earthquakes. It underlies the city of Ventura and runs offshore, and thus may also be capable of generating tsunamis.
Since it was identified as an active and potentially dangerous fault in the late 1980s, there has been a controversy about its location and geometry underground, with two competing models.
Originally, researchers assumed the fault was planar and steeply dipping, like a sheet of plywood positioned against a house, to a depth of about 21 km (13 miles). But a more recent study, published in 2014, suggested the fault had a "ramp-flat geometry," with a flat section between two tilting sections, similar to a portion of a staircase.
Now, a new study carried out by a team of researchers from the University of California, Riverside used computer modeling to test the two alternatives.
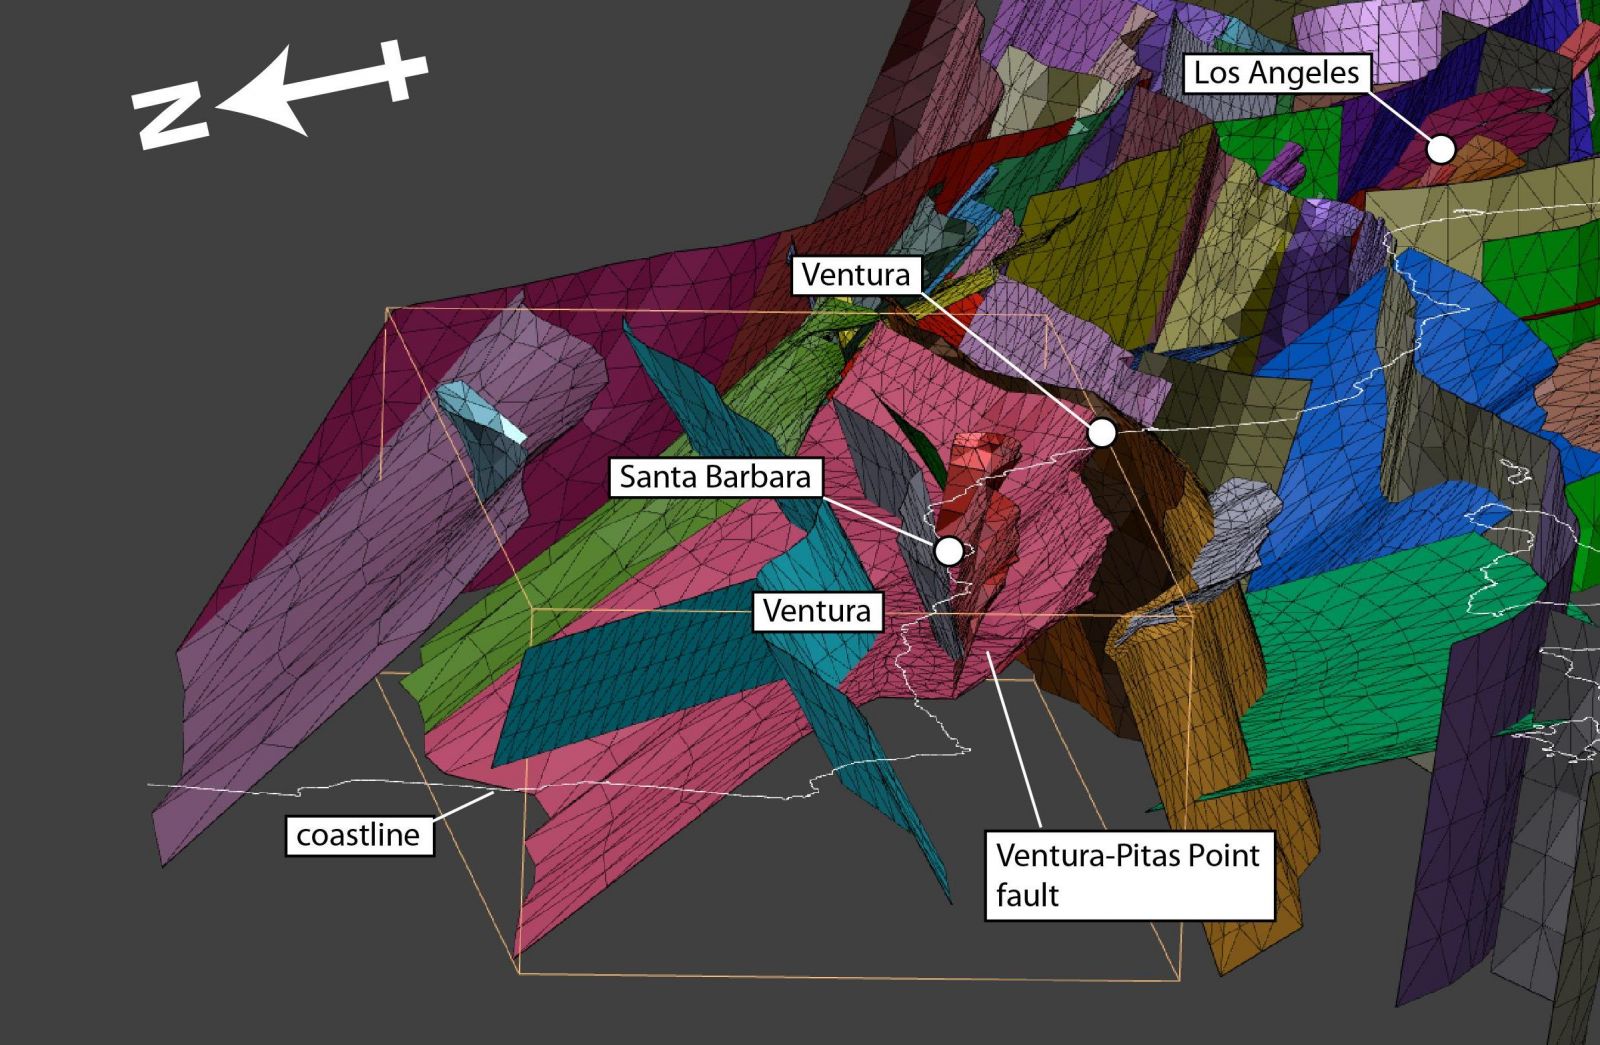
The figure shows the location of the Ventura-Pitas Point fault with respect to the cities involved. The view is of Southern California, as seen from the Pacific coast looking east. The thin white line is the coastline; the outlines of the Channel Islands can be seen off to the right (the south). The pink triangulated surface is the Ventura-Pitas Point fault. At the edge of it can be seen the stair-step cross-section, the flat part being under Santa Barbara. Image credit: Gareth J. Funning and Scott T. Marshall.
In these computer models, the crust, outermost layer of rock, in the Ventura-Santa Barbara region is represented as a three-dimensional volume, with the surfaces of the region's faults as weaknesses within it. That volume is then "squeezed" at the rate and direction that the region is being squeezed by plate tectonics. In comparisons of the expected movement in the models with GPS data, the fault with the staircase-like structure was favored.
That means more of the fault, which runs westward 96 km (60 miles) from the city of Ventura, through the Santa Barbara Channel, and beneath the cities of Santa Barbara and Goleta, is closer to the surface. That would likely cause stronger shaking during an earthquake and more damage.
"Our models confirm that the Ventura-Pitas Point fault is a major fault, that lies flat under much of the coast between Ventura and Santa Barbara," said Gareth Funning, an associate professor of geophysics at UC Riverside, one of the authors of the study.
"This means that a potential source of large earthquakes is just a few miles beneath the ground in those cities. We would expect very strong shaking if one occurred."
Future research will address the consequences of there being a fault ramp under Ventura. Researchers now can run more accurate simulations based on the ramp model to predict where the shaking will be strongest, and whether they would expect a tsunami.
The tsunami produced by a quake on this fault would affect Santa Barbara, Ventura, and Santa Monica, California Geological Survey previously said. A big earthquake on this fault is estimated to occur every 400 to 2 400 years, the last being about 800 years ago.
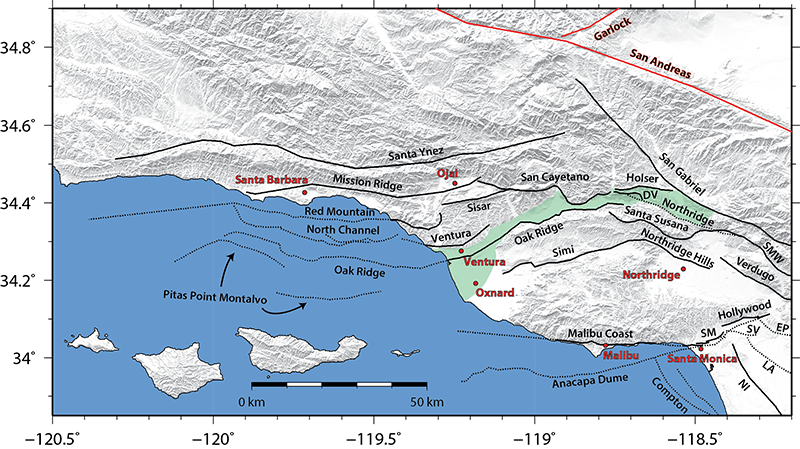
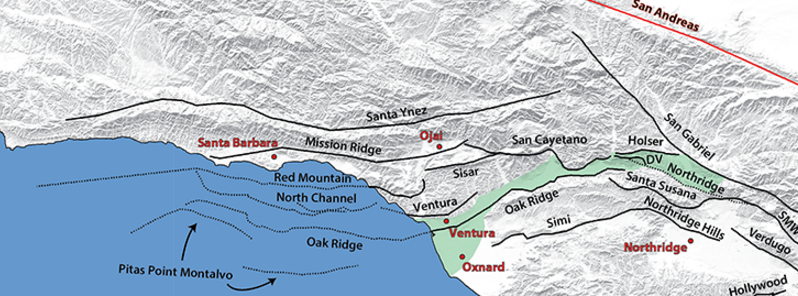
Location map, fault traces, and shaded digital elevation model of the western Transverse Ranges region. Credit: Scott T. Marshall et al.
Reference:
- "Mechanical models favor a ramp geometry for the Ventura-pitas point fault, California" – Scott T. Marshall, Gareth J. Funning, Hannah E. Krueger, Susan E. Owen, John P. Loveless – Geophysical Research Letters – February 13, 2017 – DOI: 10.1002/2016GL072289
Abstract
Recent investigations have provided new and significantly revised constraints on the subsurface structure of the Ventura-Pitas Point fault system in southern California; however, few data directly constrain fault surfaces below ~6 km depth. Here, we use geometrically complex three-dimensional mechanical models driven by current geodetic strain rates to test two proposed subsurface models of the fault system. We find that the model that incorporates a ramp geometry for the Ventura-Pitas Point fault better reproduces both the regional long term geologic slip rate data and interseismic GPS observations of uplift in the Santa Ynez Mountains. The model-calculated average reverse slip rate for the Ventura-Pitas Point fault is 3.5 ± 0.3 mm/yr, although slip rates are spatially variable on the fault surface with > 8 mm/yr predicted on portions of the lower ramp section at depth.
Featured image: Location map, fault traces, and shaded digital elevation model of the western Transverse Ranges region. Credit: Scott T. Marshall et al.
Commenting rules and guidelines
We value the thoughts and opinions of our readers and welcome healthy discussions on our website. In order to maintain a respectful and positive community, we ask that all commenters follow these rules.