San Francisco Millennium Tower sinking 5 cm (2 inches) per year
According to new data gathered by the Sentinel-1 satellites, the Millennium Tower skyscraper, San Francisco, appears to be sinking at a rate of a few centimeters per year. This and similar studies are aiming at improving the quality of monitoring of the urban ground movements for subsidence.
According to the experts, the recent sinking and tilting activity noted at the Millennium Tower is likely connected to the supporting piles which are not firmly situated on the underlying bedrock.
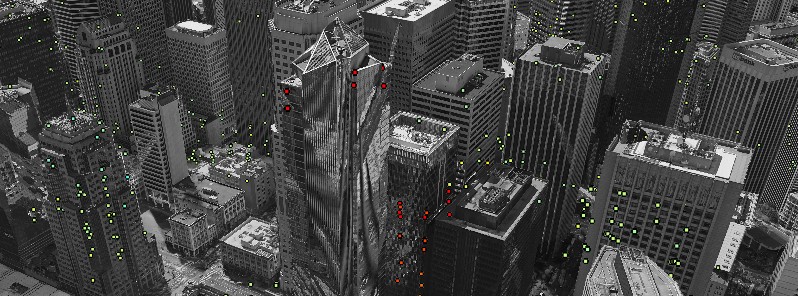
Data from the Sentinel-1 satellites show that Millennium Tower in San Francisco is sinking by about 40 mm (1.6 inches) a year in the ‘line of sight’ – the direction that the satellite is ‘looking’ at the building. The color scale ranges from 40 mm a year away from the radar (red) to 40 mm a year towards radar (blue). Green represents stable targets. Image credit: Contains modified Copernicus Sentinel data (2015–16) / ESA SEOM INSARAP study / PPO.labs / Norut / NGU
To investigate what is going on, the researchers have utilized multiple radar scans from the Copernicus Sentinel-1 twin satellites, collected in the period between February 22, 2015, and September 20, 2016, in the hope of pinpointing surface changes of the order of a millimeter. Because of the satellite's broad coverage and frequent data collection, the technique is also very good for locating displacement hotspots over large areas.
The study revealed the tower in San Francisco is sinking by about 40 mm (1.6 inches) per year in the line of sight, the direction in which the satellite was looking at the building. This means the vertical subsidence is about 50 mm (2 inches) per year, assuming no tilting.
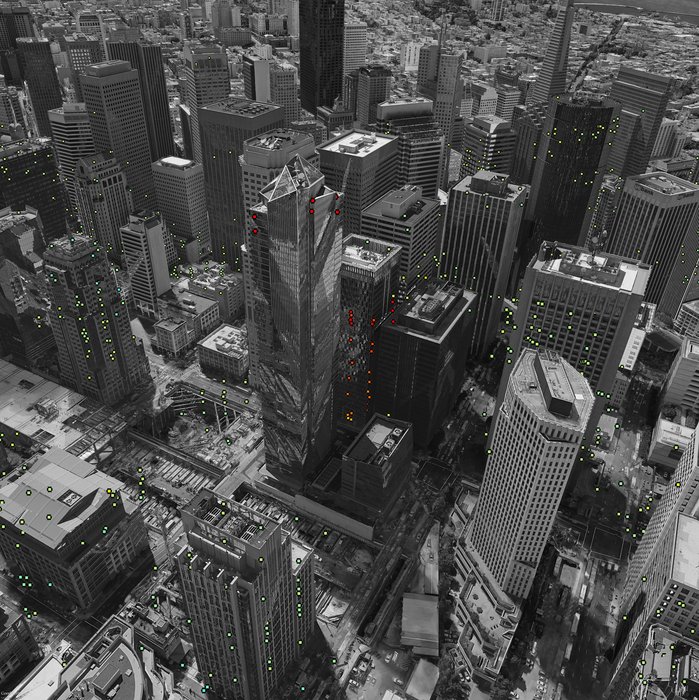
Sentinel-1 radar data showing ground displacement of downtown San Francisco. Green colors indicate no detected movement, points in yellow, orange and red indicate where structures are subsiding, or sinking. Image credit: Contains modified Copernicus Sentinel data (2015–16) / ESA SEOM INSARAP study / PPO.labs / Norut / NGU
The Sentinel-1 satellites are used for watching land movements, monitoring Arctic sea ice, sea-ice mapping, forest mapping, surveillance of the marine environment, water and soil management, and mapping in support of the various humanitarian and crisis situations.
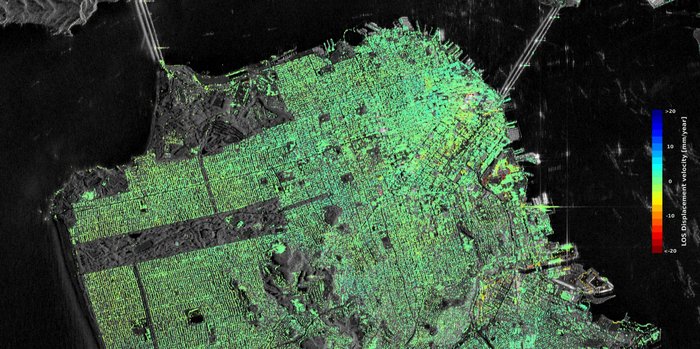
A team from Norut, PPO lands and the Geological Survey of Norway, in cooperation with the experts from ESA, have conducted mapping of the wider San Francisco area, including buildings situated along the Hayward fault and the subsidence zone in the San Rafael Bay.
Researchers have found the land around the Pleasanton city was uplifted, a phenomenon which likely resulted from the replenishment of groundwater, after a four-year long period of drought.
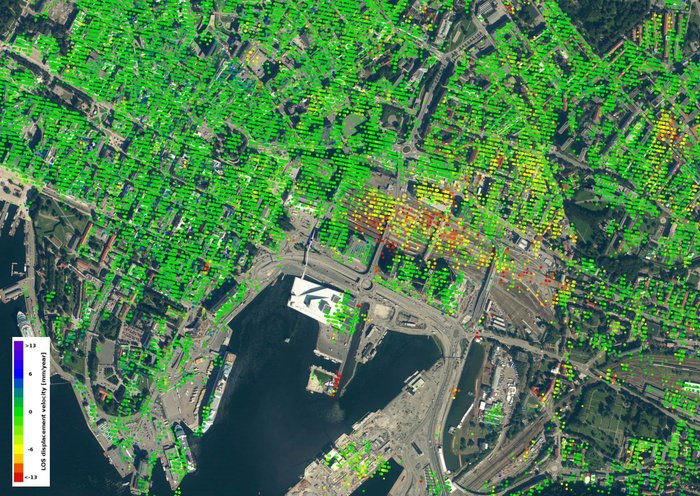
Data from the Sentinel-1 satellites showing that parts of the Oslo train station sinking. It can also be observed that the new opera house, the white structure located by the fjord south of the subsiding area, has not moved. Image credit: Contains modified Copernicus Sentinel data (2014–16) / ESA SEOM INSARAP study / InSAR Norway project / NGU / Norut / PPO.labs
A similar phenomenon was detected in several cities in Europe, for example in Oslo, Norway, around the local train station. The data collected from the Sentinel – 1 satellites in the period between December 26, 2014, and October 28, 2016, indicate older areas of the station are undergoing strong subsidence while the newer parts are firmly situated on the underlying bedrock. The rate of sinking is estimated at 10 – 15 mm (0.4 – 0.6 inches) per year, in the line of sight, implying a vertical subsidence of 12 – 18 mm (0.5 – 0.7 inches) per year.
“Experience and knowledge gained within the ESA’s Scientific Exploitation of Operational Missions program give us strong confidence that Sentinel-1 will be a highly versatile and reliable platform for operational deformation monitoring in Norway, and worldwide,” said John Dehls from the Geological Survey of Norway.
"The Copernicus Sentinel-1 mission is, for the first time, making it possible to launch operational national deformation mapping services. In Norway, we have already initiated a framework project to provide nationwide basic deformation products to the public, with a free and open data policy. Many other countries in Europe are also working towards setting up similar services,” said Dag Anders Moldestad from the Norwegian Space Centre.
Featured image: Data from the Sentinel-1 satellites show that Millennium Tower in San Francisco is sinking by about 40 mm (1.6 inches) a year in the ‘line of sight’ – the direction that the satellite is ‘looking’ at the building. The color scale ranges from 40 mm a year away from the radar (red) to 40 mm a year towards radar (blue). Green represents stable targets. Image credit: Contains modified Copernicus Sentinel data (2015–16) / ESA SEOM INSARAP study / PPO.labs / Norut / NGU
Incredible. The cheapest option now for the long run might well be to just to take down the building and build a new one. A better one. With these new ESA satellites showing even millimeter shifts in grounds and buildings and ice layers i expect a lot of more stories over the coming years of moving land areas that were not previously know about and thus of any previous concern as more people start to analyze these EU/ESA Sentinel Satellite data. Indicating long overdue new earth quakes with people living on greatly moving earth quakes zones. But likely for the best as it will push people from those dangerous locations.