2016 Arctic sea ice minimum the second-lowest on record
The Arctic sea ice appears to have reached its seasonal minimum for 2016 on September 10, the NSIDC said yesterday in a preliminary announcement. A relatively rapid loss of sea ice in the first ten days of September has pushed the ice extent to a statistical tie with 2007 for the second lowest in the satellite record. September’s low extent followed a summer characterized by conditions generally unfavorable for sea ice loss.
Walt Meier, a sea ice scientists with NASA's GSFC said it’s pretty remarkable that this year’s sea ice minimum extent ended up the second lowest after how the melt progressed in June and July. “June and July are usually key months for melt because that’s when you have 24 hours of sunlight each day. This year we lost momentum during those two months.”
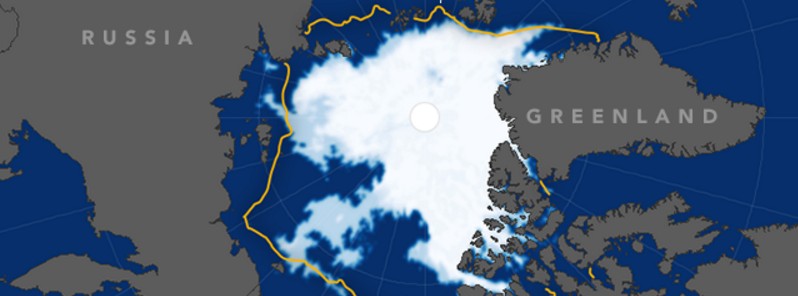
Arctic sea ice extent stood at 4.14 million km2 (1.60 million mi2) on September 10, 2016. This year’s minimum extent is 750 000 km2 (290 000 mi2) above the record low set in 2012 and is well below the two standard deviation range for the 37-year satellite record. Satellite data show extensive areas of open water in the Beaufort and Chukchi seas, and in the Laptev and East Siberian seas.
During the first ten days of September, the Arctic lost ice at a faster than average rate. Ice extent lost 34 100 km2 (13 200 mi2) per day compared to the 1981 to 2010 long-term average of 21 000 km2 (8 100 mi2) per day.
The early September rate of decline also greatly exceeded the rate observed for the same period in 2012 (19 000 km2, or 7 340 mi2, per day). Recent ice loss has been most pronounced in the Chukchi Sea. This may relate to the impact of two strong cyclones that passed through the region during August.
Satellite passive microwave data and images from the Moderate Resolution Imaging Spectroradiometer (MODIS) suggest that the southern Northwest Passage routes are still open. While the passive microwave data show that the Northern Sea route is open, MODIS data reveal a narrow band of scattered sea ice blocking the passage near the Taymyr Peninsula.
Arctic sea ice extent for August 2016 was 5.60 million km2 (2.16 million mi2). On September 10, 2016 it was 4.14 million km2 (1.60 million mi2).The magenta line shows the 1981 to 2010 median extent for that month. The black cross indicates the geographic North Pole. Sea Ice Index data. About the data. Credit: National Snow and Ice Data Center
The sea ice cover on the Arctic Ocean and surrounding seas regulates the planet’s temperature, influences the circulation of the atmosphere and ocean, and affects life in Arctic communities and ecosystems.
"What happens in the Arctic doesn't stay in the Arctic," Pennsylvania State University climate scientist Michael Mann said.
"It looks increasingly likely that the dramatic decrease in Arctic sea ice is impacting weather in mid-latitudes and may be at least partly responsible for the more dramatic, persistent and damaging weather anomalies we've seen so many of in recent years."
Conditions in context
Weather in early September was warm along the Siberian coast (up to 9 °C / 16 °F above average), with high pressure over the same region and strong winds across the central Arctic.
However, weather over the Arctic Ocean this past summer has been generally stormy, cool, and cloudy – conditions that previous studies have shown to generally limit the rate of summer ice loss. That September ice extent nevertheless fell to second lowest in the satellite record is hence surprising.
Averaged for July through August, air temperatures at the 925 hPa level (about 2 500 feet above sea level) were 0.5 to 2 °C (1 to 4 °F) below the 1981 to 2010 long-term average over much of the central Arctic Ocean, and near average to slightly higher than average near the North American and easternmost Siberian coasts. Reflecting the stormy conditions, sea level pressures were much lower than average in the central Arctic during these months.
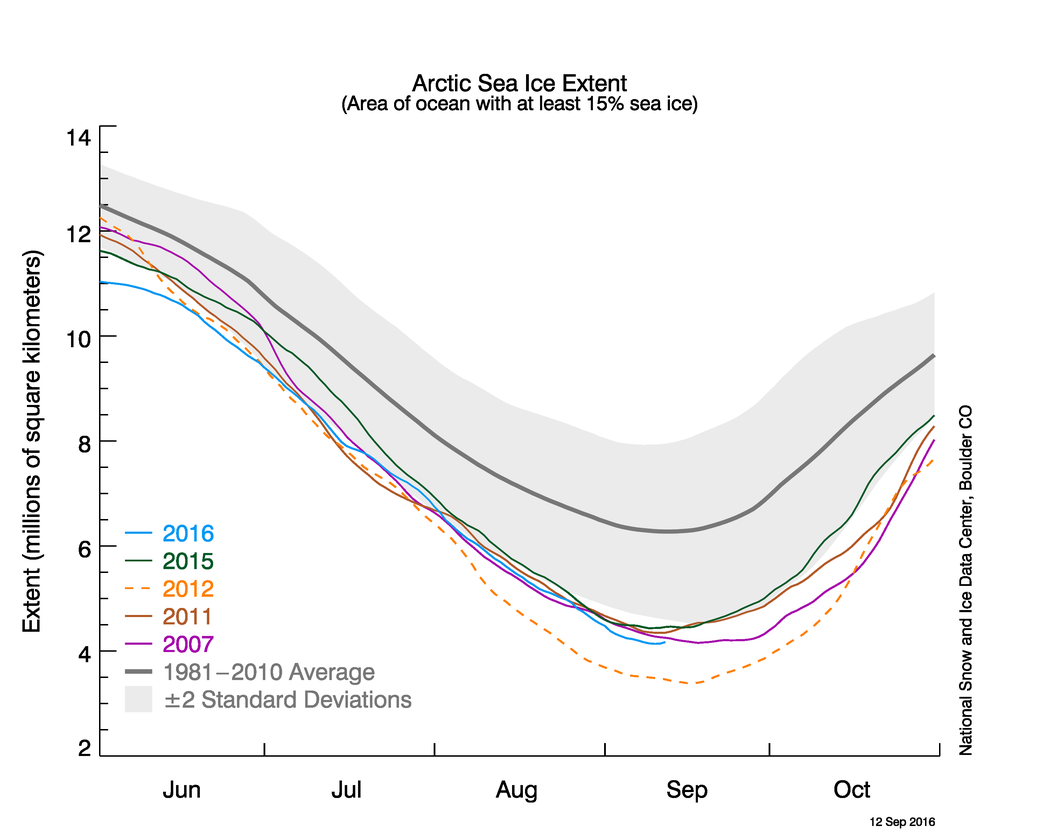
The graph above shows Arctic sea ice extent as of September 5, 2016, along with daily ice extent data for four previous years. 2016 is shown in blue, 2015 in green, 2014 in orange, 2013 in brown, and 2012 in purple. The 1981 to 2010 average is in dark gray. The gray area around the average line shows the two standard deviation range of the data. Sea Ice Index data. Credit: National Snow and Ice Data Center
Why did extent fall to a tie for second lowest with 2007?
The 2016 Arctic melt season started with a record low maximum extent in March, and sea ice was measured at record low monthly extents well into June. Computer models of ice thickness, and maps of sea ice age both indicated a much thinner ice pack at the end of winter.
Statistically, there is little relationship between May and September sea ice extents after removing the long-term trend, indicating the strong role of summer weather patterns in controlling sea ice loss. However, the initial ice thickness may play a significant role. As noted in NSIDC's mid-August post, the upper ocean was quite warm this summer and ocean-driven melting is important during late summer. The science community will be examining these issues in more detail in coming months.
Ice loss primarily in the northern Chukchi Sea
The late season ice loss appears to have been greatest in an extended area of patchy ice reaching from the eastern Beaufort Sea to the northern Chukchi Sea. This is in the area influenced by the two strong cyclones discussed in the August posts – the strong winds appear to have compacted the ice cover and may have led to an upward mixing of warm ocean water.
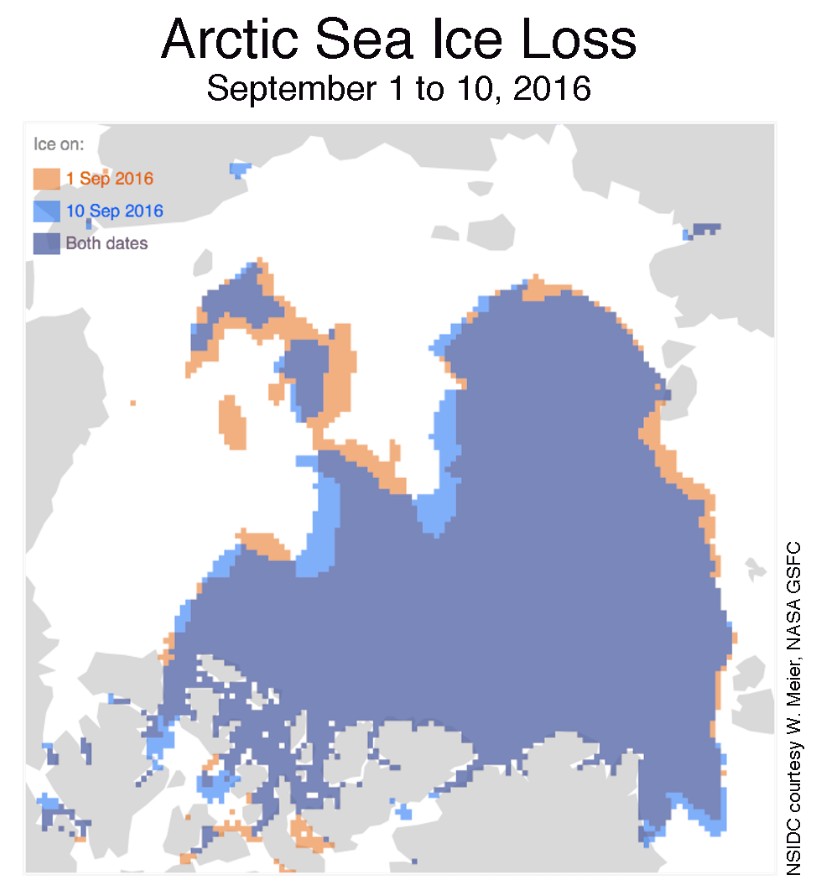
This figure compares Arctic sea ice extent for September 1 (orange) and September 10 (blue), with overlap areas in purple. Credit: National Snow and Ice Data Center
Previous minimum Arctic sea ice extents
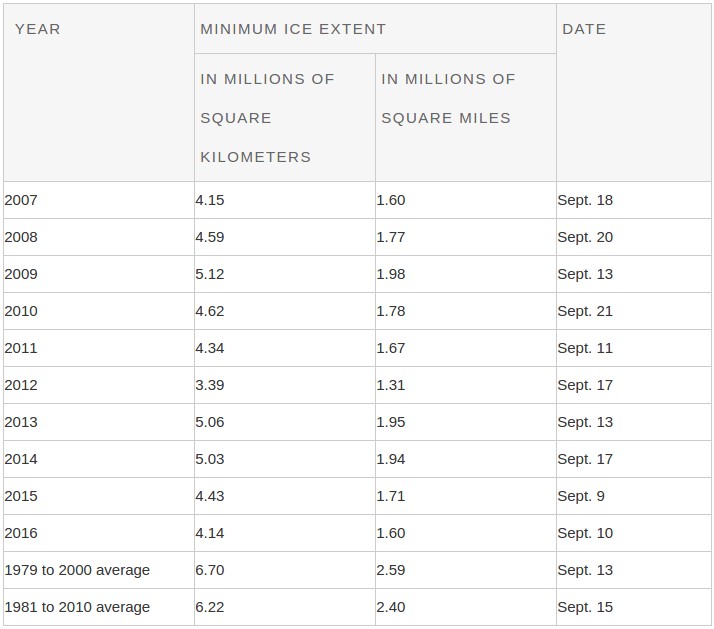
Previous minimum Arctic sea ice extents. Credit: NSIDC
Ten lowest minimum Arctic sea ice extents (1981 to 2010 average)
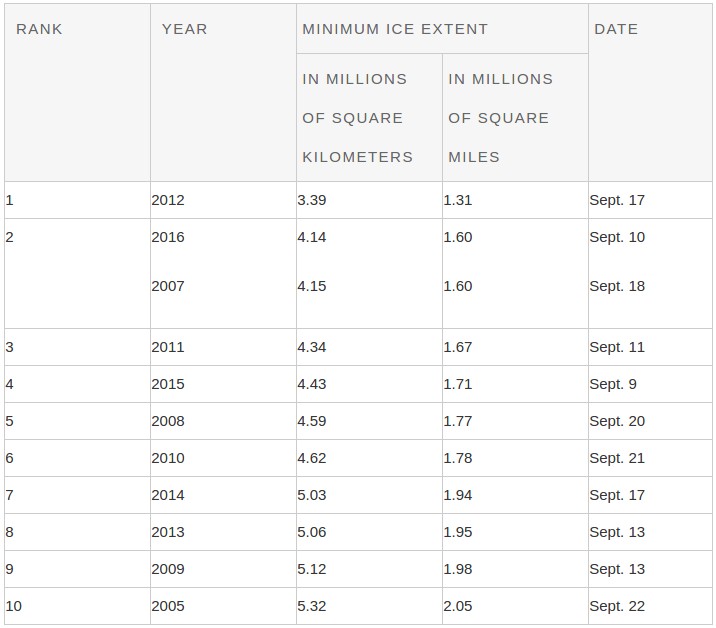
Ten lowest minimum Arctic sea ice extents (1981 to 2010 average). Credit: NSIDC
Note that the dates and extents of the minima have been re-calculated from what NSIDC posted in previous years. In June 2016, NSIDC transitioned to using data from the DMSP F-18 satellite, due to issues with the F-17 satellite. Data beginning April 1, 2016 are from F-18. In July 2016, Sea Ice Index data were updated to Version 2. These changes do not significantly affect sea ice trends and year-to-year comparisons, but in some instances users may notice small changes in values from the previous version of the data. Details on the changes are discussed in the Sea Ice Index documentation.
Source: NSIDC. Read the full preliminary report, here.
Featured image: NASA Earth Observatory images by Joshua Stevens, using data from the Advanced Microwave Scanning Radiometer 2 (AMSR-2) sensor on the Global Change Observation Mission 1st-Water (GCOM-W1) satellite, the Scanning Multichannel Microwave Radiometer (SMMR) on the Nimbus-7 satellite, and analyses from Parkinson and DiGirolamoa (2016).
Paul Beckwith
Sorry Folks. Arctic Sea-Ice On Last Legs.
https://youtu.be/xknMZFYUp2U
https://polarbearscience.com/2016/07/15/hudson-bay-update-lots-of-sea-ice-well-positioned-for-polar-bears-to-get-ashore/
https://www.youtube.com/watch?v=svn82AuHYAI
https://www.youtube.com/watch?v=8oODkLTizy0