State of the climate in 2014
The key parameters which indicate the Earth's changing climate, including land and ocean temperature, sea level and greenhouse gases, have set new records in the year 2014, according to "State of the climate in 2014" – Special Supplement to the Bulletin of the American Meteorological Society released this month. These essential climate variables, carefully monitored and recorded each year, have continued to follow the long-term rising trends throughout the year.
Four independent surface temperature observational analyses have reached a conclusion that the year 2014 was the warmest year on record. However, one needs to bear in mind a measure of uncertainty for annual rankings in the process of analyses, due to uncertainty in the underlying annual global temperature anomalies themselves. Read more about it at the end of the article.
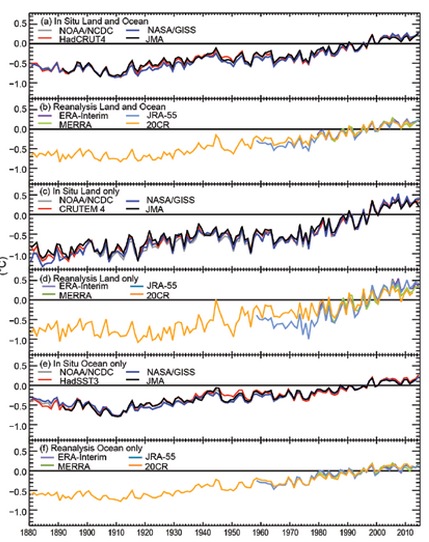
Global average surface temperature anomalies (1981–2010 base period). Image credit: State of the Climate in 2014 report, American Meteorological Society.
Above average warm conditions were present across the globe, land and ocean surfaces, during 2014. According to four in-situ analyses, the global average temperature was reported highest since it's recording began in the mid-to-late 1800's. The 2014 globally averaged surface temperature was between 0.27°C and 0.29°C above the average measured in the period between 1981 to 2010. Seventeen of the eighteen warmest years on record have occurred over the last 18 years. (A. Sánchez-Lugo, P. Berrisford and C. Morice,2015: Surface Temperature[in "State of the climate in 2014"].Bull.Amer.Meteor.Soc.96(7),S9)
The major greenhouse gases, including carbon dioxide, methane and nitrous oxide have all reached high atmospheric concentrations. For example, carbon dioxide has increased by 1.9 ppm and it reached a globally averaged value of 397.2 ppm for the year 2014. These five major greenhouse gases, in combination with 15 minor ones have contributed 2.94 W/m2 of direct radiative forcing, 36% greater contribution than only quarter a century ago.
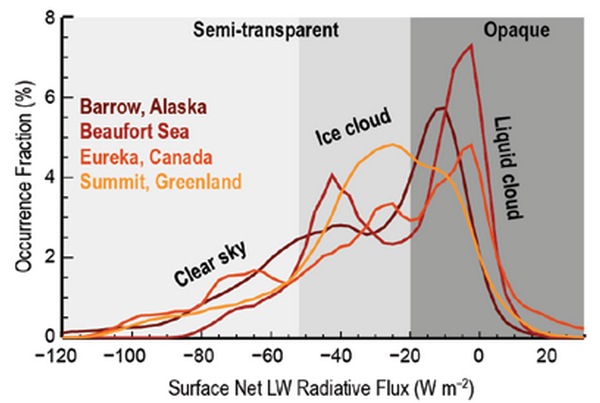
Distributions of observed net longwave radiation at the surface under clear skies, ice clouds, and liquid clouds at four Arctic locations. Image credit: State of the Climate in 2014 report, American Meteorological Society.
The highest annual global surface temperature was observed in at least 135 years of modern record keeping, according to four independent observational analyses. Europe has observed it's warmest year on record, and many of it's countries broke the national temperature records. A number of Asian countries have had annual temperatures among their 10 warmest on record. The above average temperatures have been reported across most of the Africa, the third warmest year on record was measured in Australia while Mexico reported 2014 to be the warmest year on record. Argentina and Uruguay reported their second warmest year on the record, while eastern North America was the only part of the world to report below-average annual temperature.
It is highly likely that the oceans were responsible for driving the global surface temperatures. The globally averaged sea surface temperature (SST) was also highest recorded, although the year was mainly ENSO neutral.
The oceans absorb more than 90% of excess greenhouse gas forcing heat. Due to ocean warming accompanied with the land ice melt, global average sea level in 2014 was record high, 67 mm higher than measured in 1993. An increased hydrological cycle has also been observed, as reflected in salinity anomalies in the sea surface salinity (SSS) trends, where the salinity was increasing in the salty regions while fresh regions were observed to become fresher.
Precipitation over the world's oceans was above the average, while it was below across the land surfaces. Southeastern Brazil and the western U.S. reported droughts, while above-normal summer monsoon rainfall was reported over the southern coast of west Africa. Summer monsoon rainfall was above average across the eastern Africa, apart in the areas of western south Sudan and Ethiopia. The south Asian monsoon was below average, setting a record for the dry period during June.
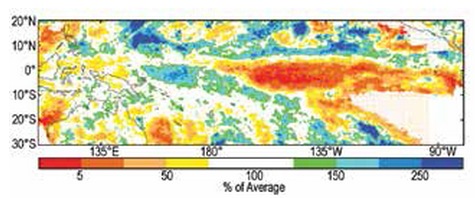
The rainfall data are from the NOAA/TRMM analysis (Huffman et al. 2007), averaged over Jan–Mar 2014, as a percentage of the 1998–2012 average. Image credit: State of the Climate in 2014 report, American Meteorological Society.
Precipitation was quite variable across the globe. On balance, precipitation over the world’s oceans was above average, while below average across land surfaces. Drought continued in southeastern Brazil and the western United States. Heavy rain during April–June led to devastating floods in Canada’s Eastern Prairies. Above-normal summer monsoon rainfall was observed over the southern coast of West Africa, while drier conditions prevailed over the eastern Sahel. Generally, summer monsoon rainfall over eastern Africa was above normal, except in parts of western South Sudan and Ethiopia. The south Asian summer monsoon in India was below normal, with June being record dry.
91 major tropical cyclones were observed during the year 2014, which is above the global average of 82 for the 1981-2010 period.
The temperatures over the land surface in the Arctic were the fourth highest in a period of 115 years of records. The snow melt occurred about 20-30 days earlier than the 1998-2010 average during 90% of the melt season, which has contributed to lowering the average summer albedo to the second lowest recorded over Greenland since the observations began in 2000. New record high temperatures at 20 m depth were measured on the North Slope of Alaska.
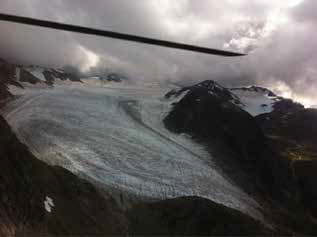
Lemon Creek Glacier, Alaska, in September 2014: the area of retained snowcover is insignificant. For this glacier an equilibrium balance requires 62% snowcover. Image credit: Chris McNeil.
Arctic minimum extent of the sea ice was the sixth lowest since satellite records began in 1979, in September 2014. In the Antarctic, the sea ice extent set several new records for the year. On September 20, 2014, a record large daily Antarctic sea ice extent measuring 20.14 x 10⁶ km2 occurred.
The 2014 Antarctic stratospheric ozone hole was 20.9 million km2 when averaged from September 7 to October 13, the sixth smallest on record and continuing a decrease, albeit statistically insignificant, in area since 1998. (J. Blunden and D.S. Arndt, 2015: Abstract in ["State of the climate in 2014"].Bull.Amer.Meteor.Soc.96(7),Sxiv)
Four independent surface temperature observational analyses have reached a conclusion that the year 2014 was the warmest year on record. However, one needs to bear in mind a measure of uncertainty for annual rankings in the process of analyses, due to uncertainty in the underlying annual global temperature anomalies themselves.
There is an estimated 48% probability that 2014 was the warmest year over the period between 1880 and 2014, in the NOAA record. This means that "while we cannot conclusively claim that 2014 was the warmest year in the real world when uncertainty is factored in, the 48% probability does not imply that 2014 was anything other than a very warm year, and it certainly does not cast doubt on the unprecedented warmth over the last 20 years". (A. Arguez and S. Applequist, 2015: Understanding the statistical uncertainty of 2014's designation as the warmest year on record in "State of the climate in 2014"].Bull.Amer.Meteor.Soc.96(7),S12)
Source: State of the Climate in 2014, report. American Meteorological Society.
Reference:
- Blunden, J. and D.S.Arndt, Eds., 2015: State of the Climate in 2014. Bull. Amer. Meteor. Soc.96(7),S1-S267
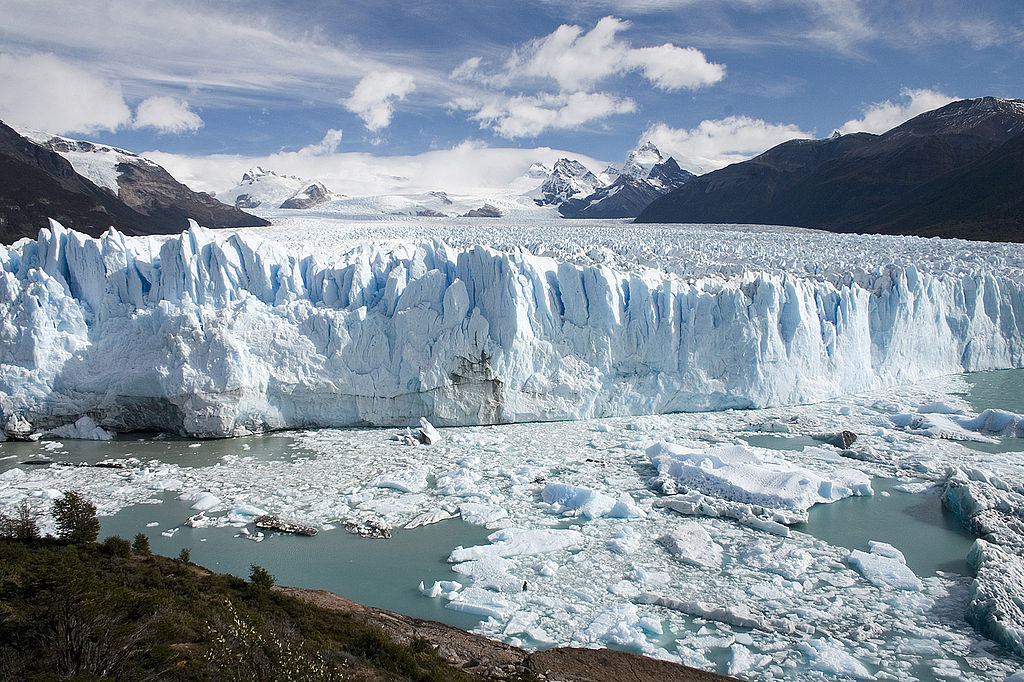
Featured image: Ice calving from the terminus of the Perito Moreno Glacier in western Patagonia, Argentina. Image credit: Luca Galuzzi.
as i understand it, .27 degree C is just over 1/4 degree rise in temp. so what? they are grasping at straws. extreme weather may be up but only this morning, july 19, the bolt report mentioned satelite detection over the last 18 years showed hardly ANY difference in temp. govt. just wants an excuse to up your taxes. no mention is made of the vast changes occurring in the solar system.
@gibbon – As you understand it, “so what?”….. No they are not grasping at straws, you are. The situation is actually dire. Did you know that the “model” for climate change IS extreme weather conditions? So you admit extreme weather is up…..hello!!! When they give these temp increase numbers they are in CELCIUS. When you convert to fahrenheit it is several degrees and not just 1 degree “so what”.
You sound like you are under the spell of deception like too many today are also. There is more then enough credible info. out there to dismiss your misguided thoughts, please look up to the not so blue sky and notice one of those credible real time pieces of evidence AND why our skies are NOT true deep blue anymore, learn the truth. Lines in the sky are not natural or by God. Silver skies are not God’s skies. White out skies are not by God either. MAN, evil man is doing all of that. Ra Ra technology!
Did you know the situation with this global warming is so bad that they are spraying you and me because of it being so bad? Called geoengineering dude, wake up! They are dimming the sun to reduce temps and cool from the extreme warming that is happening and it is happening much faster then any scientist ever thought it might.
I find it shameful that people do not notice the God given sunshine is being removed from our lives. SHAME on you for not noticing God’s glorious creations are being destroyed right over your dam head. LOOK UP and notice because we are breathing harmful chems to cool the planet & block the sun- that’s how bad it is really. You must also stop listening to the pubs they are most dangerous people. LIARS all of them, both parties are liars on this subject but the left is telling more truth about it then the right is. FACT. I am a former pub, when I woke up 3 years ago because I began to notice the planes spraying chem trails all over the skies in paradise, I left that POS party for good. Now I am just a human being horrified at how man is destroying our entire eco system and poisoning it beyond belief, “to save us from global warming”.
It is time people become aware of this dire straights issue now before it is too late, time is very short mister not so smarty pants. Geoengineeringwatch.org – go learn truth. Geoengineering = cloud seeding on an enormous scale globally. Called SRM – solar radiation management – This was discovered in 1939, old news and LEGAL. ALL Colorado’s snow is fake man made cloud seeded snow. NOW they do it to the entire planet. Polar vortex’s are sprayed cooling chems NOT REAL WEATHER – man made poison BS. You should be pissed at this???? Instead you defend it by denying it and not seeing real time crimes in the sky. Really tired of people like you who are most clueless because this makes you most dangerous to people like me.
YOU are helping the evil take our property, kill our jobs, our businesses, our lives of true freedom being sprayed away. Yes you do this because without truth most people think things are good and the banksters can keep up their crimes. Yea, they fund it all including our country and government. This is why no pub or anyone will ever do what “we the people” request of them, because the banksters own us all and so no gov. that depends on funding from banksters to run their country is in charge. Anyone who has ever had a mtg. should know this is the truth. Abide by the loan terms or you get foreclosed on! Same for USA and we’re being sprayed, so who do you think is paying for that? BANKSTERS, that’s who. Keep supporting them buddy, they will be at your door next and if you keep going with your dementia mind set, you will be brain dead from all the aluminum’s etc. in the air we are forced to breath now and tomorrow. PLEASE wake up already, you are being sprayed to cool the air – that’s how real global warming/climate change really is dude!
BTW- Global warming = a globe warming. Climate change “is in addition to” global warming. When a globe warms, climates change – DUH! Feel stupid yet? They did that to you, I am just trying to make you smart again. Tell your friends, thanks.