The weak solar cycle and its consequences
At this year's Fall Meeting of American Geophysical Union, held in San Francisco (December 9 – 13), several scientists made a presentation on weak Solar Cycle 24 and its consequences.
They agree that the current solar cycle is on track to be the weakest in 100 years and are saying this is providing an unprecedented opportunity for studying the Sun. While the weakening trend is not new for the Sun, it is new and interesting for scientists who observe and measure it today.
In this panel, scientists examined the current solar cycle in relation to past cycles and discuss the consequences of the weak solar cycle on the various layers regions between the Sun and Earth, including implications for space weather, atmosphere and climate.

Video courtesy: AGU 2013. December 11, 2013
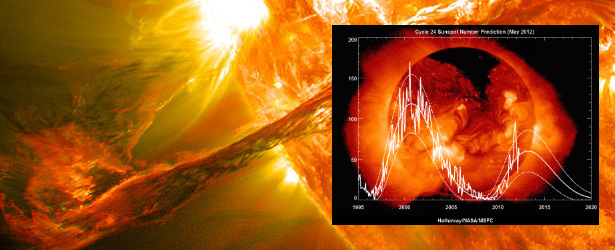
- Current solar maximum conditions are substantially weaker than prior maximum in 2002
- In 2002 CO2 and NO emitted 2 Trillion more kWh of infrared energy than in 2013
Bee sure to check PDF files used in the presentations. Source: AGU
Participants:
Nat Gopalswamy, astrophysicist, Solar Physics Laboratory, NASA Goddard Space Flight Center, Greenbelt, Maryland, USA;
Leif Svalgaard, senior research scientist, W. W. Hansen Experimental Physics Laboratory, Stanford University, Stanford, California, USA;
Marty Mlynczak, senior research scientist, Climate Science Branch, NASA Langley Research Center, Hampton, Virginia, USA;
Joe Giacalone, professor and associate director, Lunar and Planetary Laboratory, University of Arizona, Tucson, Arizona, USA.
Related
Image below shows observed and predicted active regions/sunspots count for Solar Cycle 22, 23 and 24 (1980 – 2020).
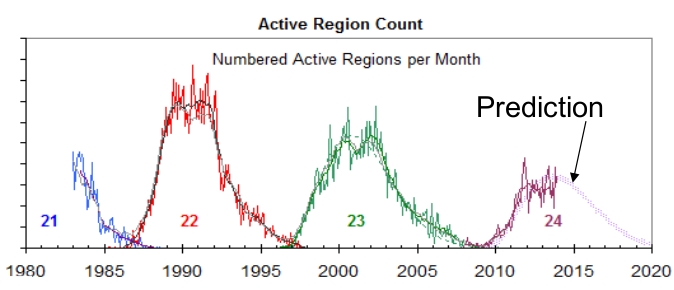
Solar cycle 24 is begining to look like Solar cycle 14 (February 1902 – August 1913). The maximum smoothed sunspot number (monthly number of sunspots averaged over a twelve-month period) observed during the solar cycle was 64.2, and the minimum was 1.5. There were a total of approximately 1019 days with no sunspots during that cycle. Source of data: SIDC
The following image shows a graph with data from 400 years of sunspot observations (1600 – 2000):
.png)
Author: Robert A. Rohde
Since c. 1749, continuous monthly averages of sunspot activity have been available and are shown here as reported by the Solar Influences Data Analysis Center, World Data Center for the Sunspot Index, at the Royal Observatory of Belgium.
These figures are based on an average of measurements from many different observatories around the world. Prior to 1749, sporadic observations of sunspots are available. These were compiled and placed on consistent monthly framework by Hoyt & Schatten (1998a, 1998b).
The most prominent feature of this graph is the c. 11 year solar magnetic cycle which is associated with the natural waxing and waning of solar activity. On longer time scales, the Sun has shown considerable variability, including the long Maunder Minimum when almost no sunspots were observed, the less severe Dalton Minimum, and increased sunspot activity during the last fifty years, known as the Modern Maximum.
The causes for these variations are not well understood, but because sunspots and associated faculae affect the brightness of the sun, solarluminosity is lower during periods of low sunspot activity. It is widely believed that the low solar activity during the Maunder Minimum may be among the principal causes of the Little Ice Age. For example, during the 70-year period from 1645 to 1715, few, if any, sunspots were seen, even during expected sunspot maximums. Western Europe entered a climate period known as the "Maunder Minimum" or "Little Ice Age." Temperatures dropped by 1.8 to 2.7 degrees Fahrenheit.
Featured image: NASA. Edit: The Watchers
It may be a premature conclusion to assume that generally lower sunspot counts translate to solar induced effects being reduced by the same amount. If one looks at the SIDC Belgium plot of sunspots and CME count (the source of the curve shown here), it is apparent that there has still been considerable CME activity. Also, many rotations with low sunspot counts have seen significant coronal holes. Although not visibly bright and dark at the wavelengths used to see sunspots, the solar wind from coronal holes is fast, hotter and denser than most CME plasma (as measured at the ACE spacecraft closer to Earth). Also, the relativity continuous output of coronal holes makes it much more likely that some of the dense stream will have some affect us typically about two days after sweeping past center disc longitude. In contrast, even when CMEs are frequent, few have much of an Earth-directed component. When dense solar wind reaches us many effects are seen: noctilucent clouds near the poles, high altitude ice crystals, orange sunsets from the gases resulting from high altitude ionization of oxygen and nitrogen, changes in arctic patterns that greatly influence weather elsewhere. Much so-called meteor dust is actually from the solar wind, not asteroids.
http://www.sidc.be/cactus/catalog/LASCO/2_5_0/dataoverview/CME_and_SSN_rate.png
Also, a low monthly average sunspot count doesn't preclude intense peak conditions. Following a number of strong flares peak sunspot counts of 280 or so were seen in mid November. Is it possible to drown walking across a stream that AVERAGES two feet deep?
http://www.sidc.be/cactus/catalog/LASCO/2_5_0/dataoverview/CME_and_SSN_rate.png